


 502 656

upregulated in
Nkx3.1
+/+
prostates (NES = 8.77;
p
<
0.001;
Fig. 2 B); conversely, genes upregulated in finasteride-
treated
Nkx3.1
/
prostates were downregulated in
Nkx3.1
+/+
prostates (NES = 14.69;
p
<
0.001;
Fig. 2B).
We further investigated the molecular consequences of
finasteride treatment through GSEA comparison of biological
pathways affected after treatment in
Nkx3.1
/
and
Nkx3.1
+/+
prostates, which also revealed strong reversal in both
upregulated and downregulated leading edges
(NES = 5.72 and 7.26, respectively;
p
<
0.001;
Fig. 2C).
The pathways significantly reverted in the finasteride- versus
vehicle-treated
Nkx3.1
/
mice include those associated with
steroid hormone signaling, such as REACTOME steroid
metabolic signaling (
p
= 0.002), and cancer initiation or
progression, including REACTOME translation (
p
0.001)
and REACTOME PI3K-AKT signaling (
p
0.001)
( Fig. 2D).
Taken together, these histopathological and molecular
studies demonstrate that the
Nkx3.1
/
prostate is profound-
ly affected by finasteride, which is evident from the striking
abrogation of the PIN phenotype and accompanied by global
reversion of the molecular phenotype towards that of normal
prostate.
[(Fig._1)TD$FIG]
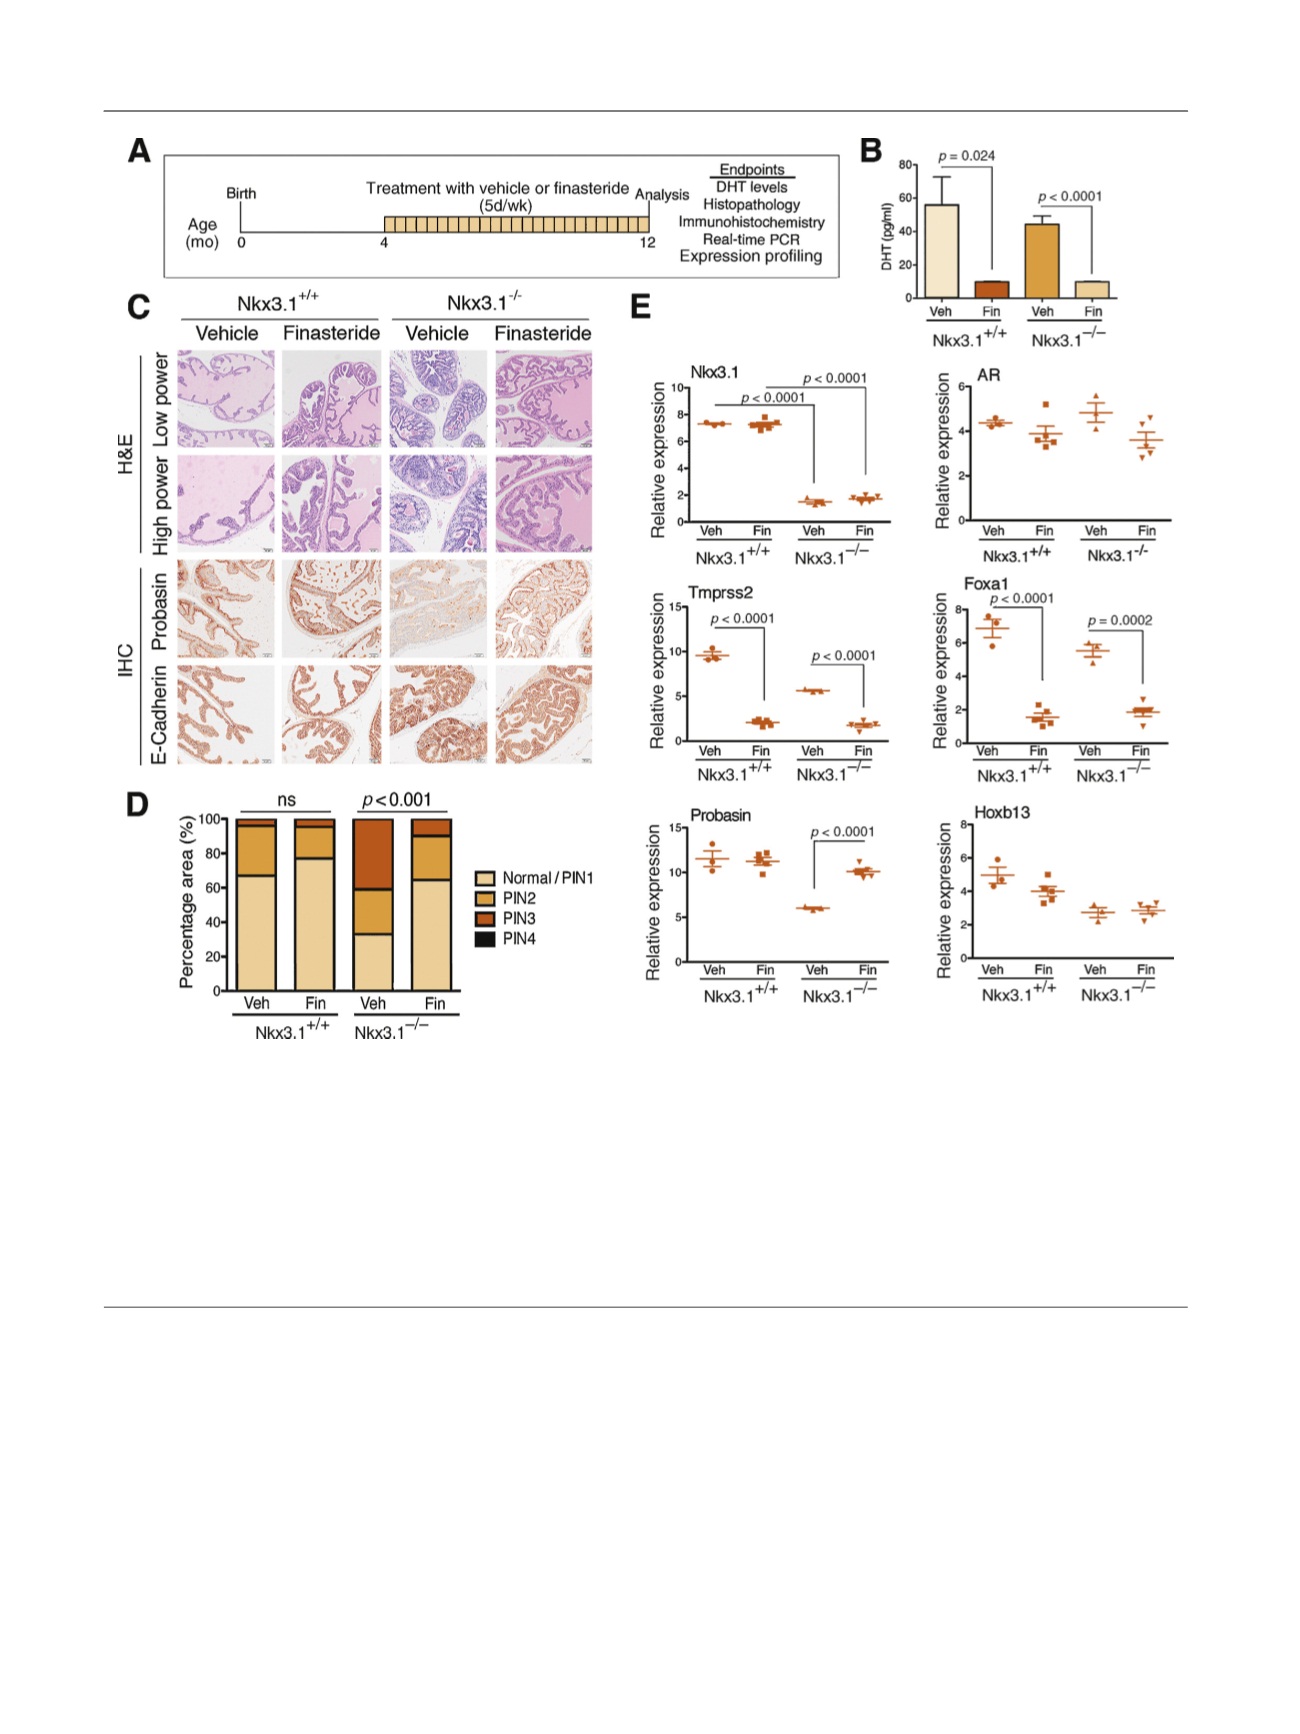
Fig. 1 – Finasteride abrogates prostatic intraepithelial neoplasia (PIN) in a genetically engineered mouse model of prostate cancer. (A) Preclinical trial
design. Cohorts of
Nkx3.1
+/+
and
Nkx3.1
S
/
S
mice aged 4 mo were randomly assigned to treatment with finasteride (1 mg/ml in phosphate-buffered
saline) or vehicle once a day on a schedule of 5 d/wk for 8 mo, until the mice were aged 12 mo. At the conclusion of the study, mice were sacrificed
and analysis of the endpoints indicated was performed. PCR = polymerase chain reaction. (B) Levels of dihydrotestosterone (DHT) in serum as indicated
(
n
= 5 per group);
p
values represent comparisons between bracketed groups and were estimated using a two-tailed two-sample
t
test. Veh = vehicle;
Fin = finasteride. (C) Histological analysis. Shown are representative images of hematoxylin and eosin (H&E) staining and immunohistochemical (IHC)
staining of anterior prostate from
Nkx3.1
+/+
and
Nkx3.1
S
/
S
mice treated with finasteride or vehicle, as indicated (
n
= 25 per group). Antibodies were as
previously reported
[19]. Scale bars represent 100
m
m (H&E low power) or 50
m
m (H&E high power and IHC staining). (D) Summary of PIN phenotype
following treatment. Shown is the percentage area of prostatic tissue that is normal/PIN1, PIN2, PIN3, and PIN4 following treatment with finasteride in
Nkx3.1
+/+
(
n
= 5 per group) and
Nkx3.1
S
/
S
(
n
= 15 per group) mice;
p
values were estimated using a two-tailed two-sample
t
test. ns = not significant. (E)
Quantitative real-time PCR was carried out using total RNA from
Nkx3.1
+/+
and
Nkx3.1
S
/
S
prostate treated with vehicle or finasteride, as indicated.
Analyses were performed in triplicate and normalized to GAPDH;
p
values were estimated using a two-tailed two-sample
t
test. mo, month.
E U R O P E A N U R O L O G Y 7 2 ( 2 0 1 7 ) 4 9 9 – 5 0 6
502