


 504 656

combined with the striking phenotypic consequences of
finasteride treatment in
Nkx3.1
/
prostates
( Fig. 2), we
reasoned that patients with low
NKX3.1
expression may be
optimal candidates for intervention with 5-ARIs. Indeed, we
found that a signature comprising activated MRs from the
positive leading edge in low
NKX3.1
5-ARI–treated prostates
was associated with adverse patient outcomes when tested
on an independent cohort of PCa patients described by
Glinsky et al
[30] .In particular, Kaplan-Meier survival
analysis comparing a high versus low level of activity of
the MR signature segregated the patients into worse and
better outcomes, respectively, on the basis of biochemical
recurrence–free survival (
p
= 0.035;
Fig. 3 E). Furthermore, a
subset of the MRs were associated with adverse outcome, as
evidenced by univariate analyses using a Cox proportional
hazards model on a second cohort described by Sboner et al
[31]in which the clinical endpoint was death due to PCa (
p
values ranging from 0.04 to 0.0001;
Fig. 3F).
We further validated these findings using a cohort of
patients who had received no treatment or a lower (0.5 mg)
or higher (3.5 mg) dose of dutasteride daily for 4 mo in a
neoadjuvant trial (
n
= 15, FHCRC cohort;
Table 1 [20]).
Similar to the WCM cohort, these patients could be grouped
on the basis of low or high
NKX3.1
expression
( Fig. 3G).
Notably, six of the MRs associated with adverse outcome (as
[17_TD$DIFF]
in
Fig. 3F) were independently validated in the FHCRC cohort
( Fig. 3 H). In particular, dutasteride treatment resulted in
reduced expression of these MRs in the low but not the high
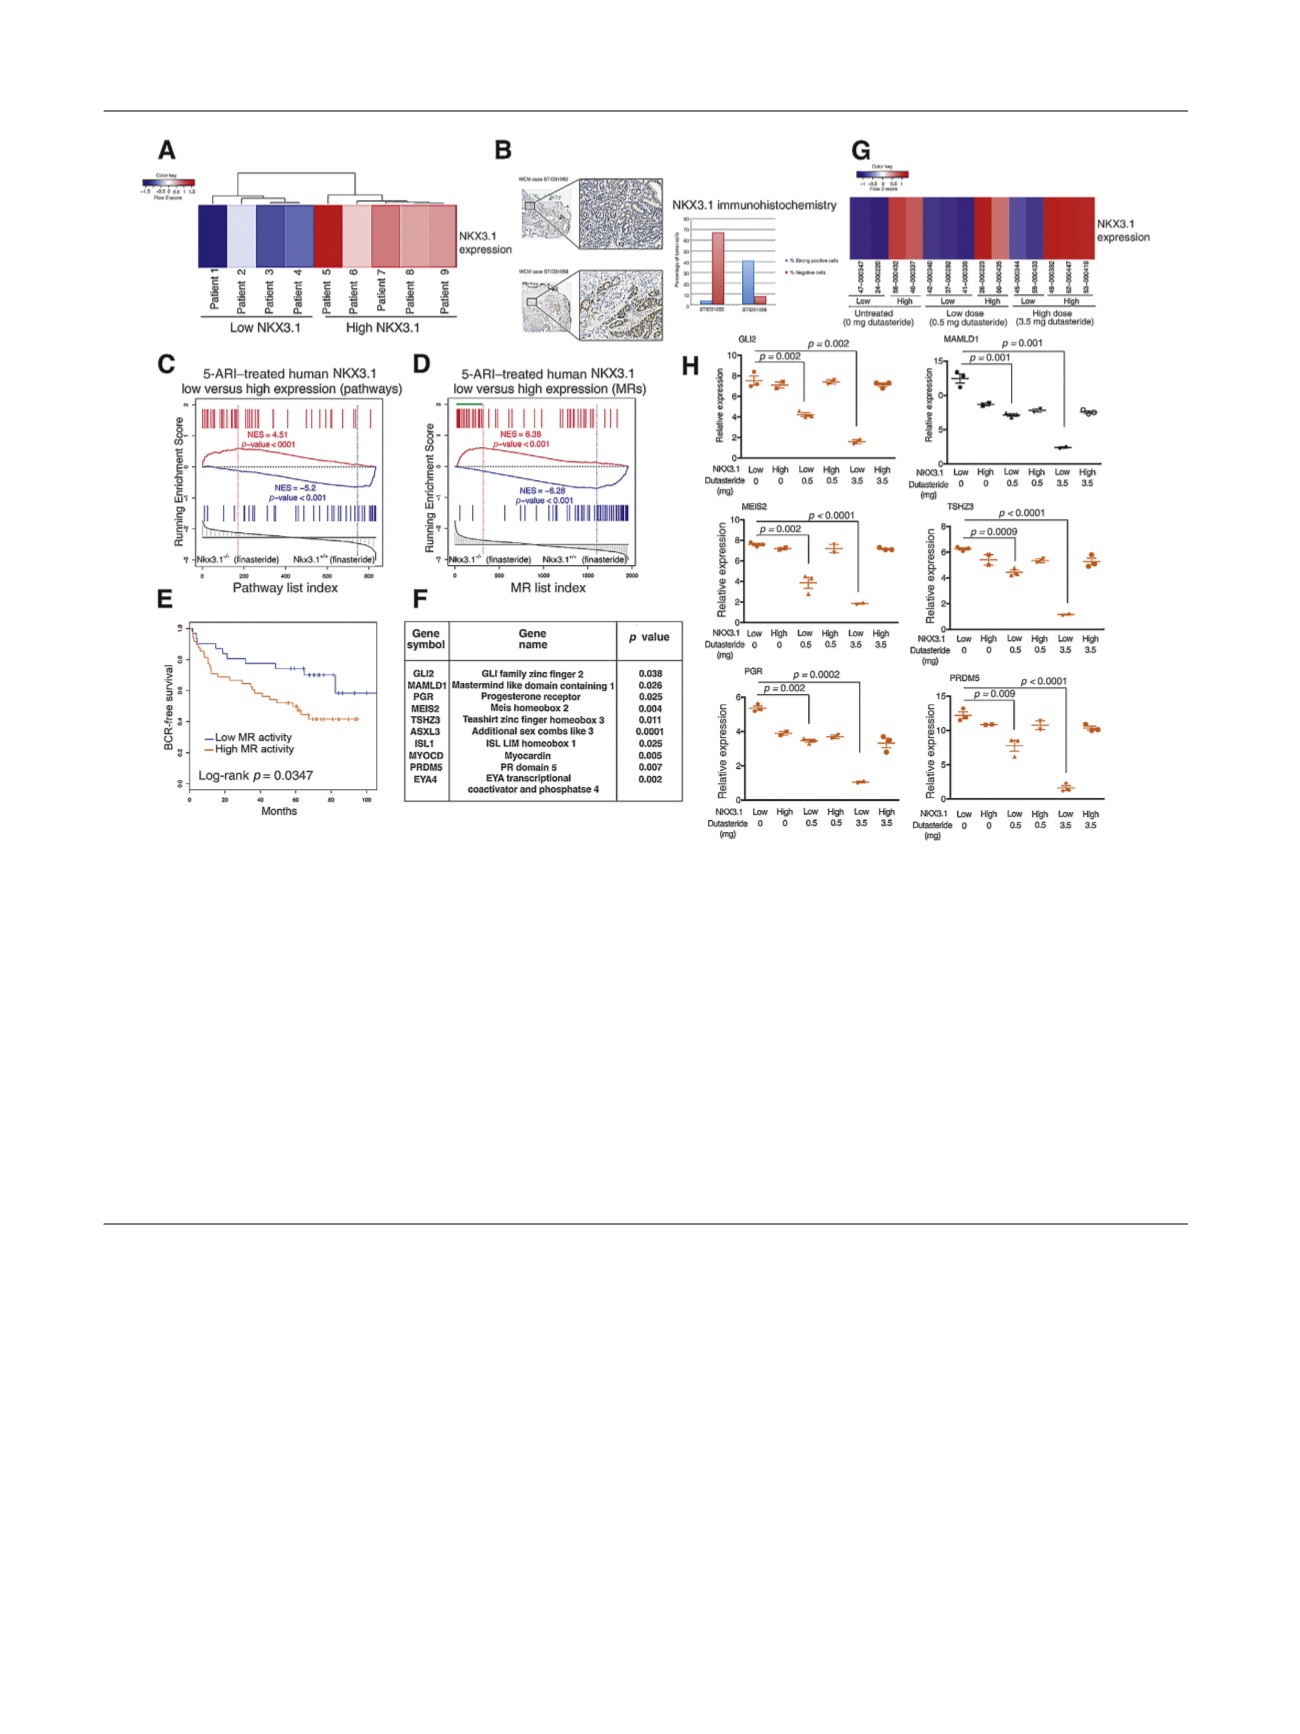
[(Fig._3)TD$FIG]
Fig. 3 – Cross-species analysis identifies a 5
a
-reductase inhibitor (5-ARI) response signature with prognostic value. (A) Heat map indicating relative
NKX3.1
expression levels in 5-ARI–treated human prostates from the Weill Cornell Medicine (WCM) cohort
( Table 1). (B) Immunohistochemistry
images at low (top) and high (bottom) magnification of representative prostate cancer cases with weak (STID31052) and strong (STID31058) NKX3.1
protein expression. The adjacent bar plot represents automated image analysis of the percentage of cells with strong (blue) or negative (red) staining
(original magnification, 20
T
and 200
T
). (C) Gene set enrichment analysis (GSEA) comparing a reference mouse pathway signature from prostates of
Nkx3.1
S
/
S
finasteride-treated mice (
n
= 5) versus
Nkx3.1
+/+
finasteride-treated mice (
n
= 5) with a query human pathway signature (top 50 differentially
changed pathways) of 5-ARI–treated low-
NKX3.1
(
n
= 4) versus high-
NKX3.1
(
n
= 5) human prostates. (D) GSEA comparing a reference mouse master
regulator (MR) signature from prostates of
Nkx3.1
S
/
S
finasteride-treated mice (
n
= 5) versus
Nkx3.1
+/+
finasteride-treated mice (
n
= 5) with a query
human MR signature (
p
< 0.001) of 5-ARI–treated low-
NKX3.1
(
n
= 4) versus high-
NKX3.1
(
n
= 5) human prostates. The green bar indicates positively
enriched MRs in the leading edge. (E) Kaplan-Meier survival analysis on the basis of activity levels of MRs of the 5-ARI response signature from (C)
using biochemical recurrence (BCR)-free survival as the endpoint as reported by Glinsky et al
[30]. The
p
value was estimated using a log-rank test to
determine the difference in outcomes between patients with higher MR activity levels (red) and those with lower MR activity levels (blue). (F) Selected
MRs with function and Cox
p
value indicated. The Cox proportional hazards model was based on MR activity levels in the data set described by Sboner
et al
[31], using prostate cancer–specific survival as the endpoint. The Cox
p
value was estimated using a Wald test. (G) Heat map indicating relative
NKX3.1
expression levels from 5-ARI–treated human prostates from the Fred Hutchinson Cancer Research Center (FHCRC) cohort including prostate
samples with no treatment, low dutasteride treatment (0.5 mg), and high dutasteride treatment (3.5 mg)
( Table 1). (H) Validation of selected MRs in
the FHCRC cohort by qualitative real-time polymerase chain reaction. Experiments were performed using five samples per group and carried out in
triplicate; values are normalized to GAPDH and
p
values were estimated using two-tailed two-sample
t
test.
E U R O P E A N U R O L O G Y 7 2 ( 2 0 1 7 ) 4 9 9 – 5 0 6
504