


 503 656

3.2.
Molecular signature of response to 5
a
-reductase inhibition
in human PCa
We investigated whether the molecular signature of
finasteride response in GEMMs may help to predict patient
response for human PCa. We performed expression profil-
ing using a cohort of PCa patients who had received 5-ARIs
before prostatectomy (
n
= 9, WCM cohort;
Table 1). These
tumor samples segregated into low or high levels of
NKX3.1
mRNA expression
( Fig. 3A), which was confirmed at the
protein level by immunohistochemistry
( Fig. 3B). Working
from the presumption that low
NKX3.1
expressers should be
analogous to
Nkx3.1
/
mice and high
NKX3.1
expressers to
Nkx3.1
+/+
mice, we compared gene signatures from 5-ARI-
treated low versus high
NKX3.1-
expressing human tumors
with finasteride-treated
Nkx3.1
/
versus
Nkx3.1
+/+
pros-
tates. Specifically, we performed cross-species GSEA to
compare biological pathways affected in finasteride-treated
Nkx3.1
/
versus
Nkx3.1
+/+
prostates with pathways affected
in 5-ARI-treated low versus high
NKX3.1-
expressing human
tumors. The findings revealed strong enrichment of path-
ways in both the upregulated and downregulated leading
edges (NES = 4.51 and 5.2, respectively;
p
<
0.001;
Fig. 3C), indicative of conservation of response to 5-ARI
treatment in mouse and human prostates that is contingent
on the status of
NKX3.1
expression.
Given this conservation, we performed cross-species
computational analyses of the NKX3.1 low and high mouse
and human treatment groups to identify MRs of treatment
response. The rationale follows from our previous work
showing that computational analyses of preclinical data
from GEMMs can predict treatment response in human PCa
[22,28], and from the broader conceptual framework that
GEMMs can be used to infer patient response for precision
prevention
[29] .First, we used MARINa to identify MRs of 5-ARI response
for the human and mouse treatment groups by interrogat-
ing a human PCa interactome with corresponding human
and mouse signatures (i.e., 5-ARI–treated low vs high
NKX3.1
-expressing human prostate and finasteride-treated
Nkx3.1
/
[16_TD$DIFF]
vs
Nkx3.1
+/+
prostate)
[22,28]. We then used
cross-species GSEA to compare the 5-ARI–responsive
‘‘human’’ and ‘‘mouse’’ MRs, which revealed strong
conservation of the signatures in both the upregulated
and downregulated leading edges (NES = 6.38 and 6.28,
respectively;
p
<
0.001;
Fig. 3 D).
On the basis of this conservation of the 5-ARI–treated
mouse and human prostate contingent on
NKX3.1
expression,
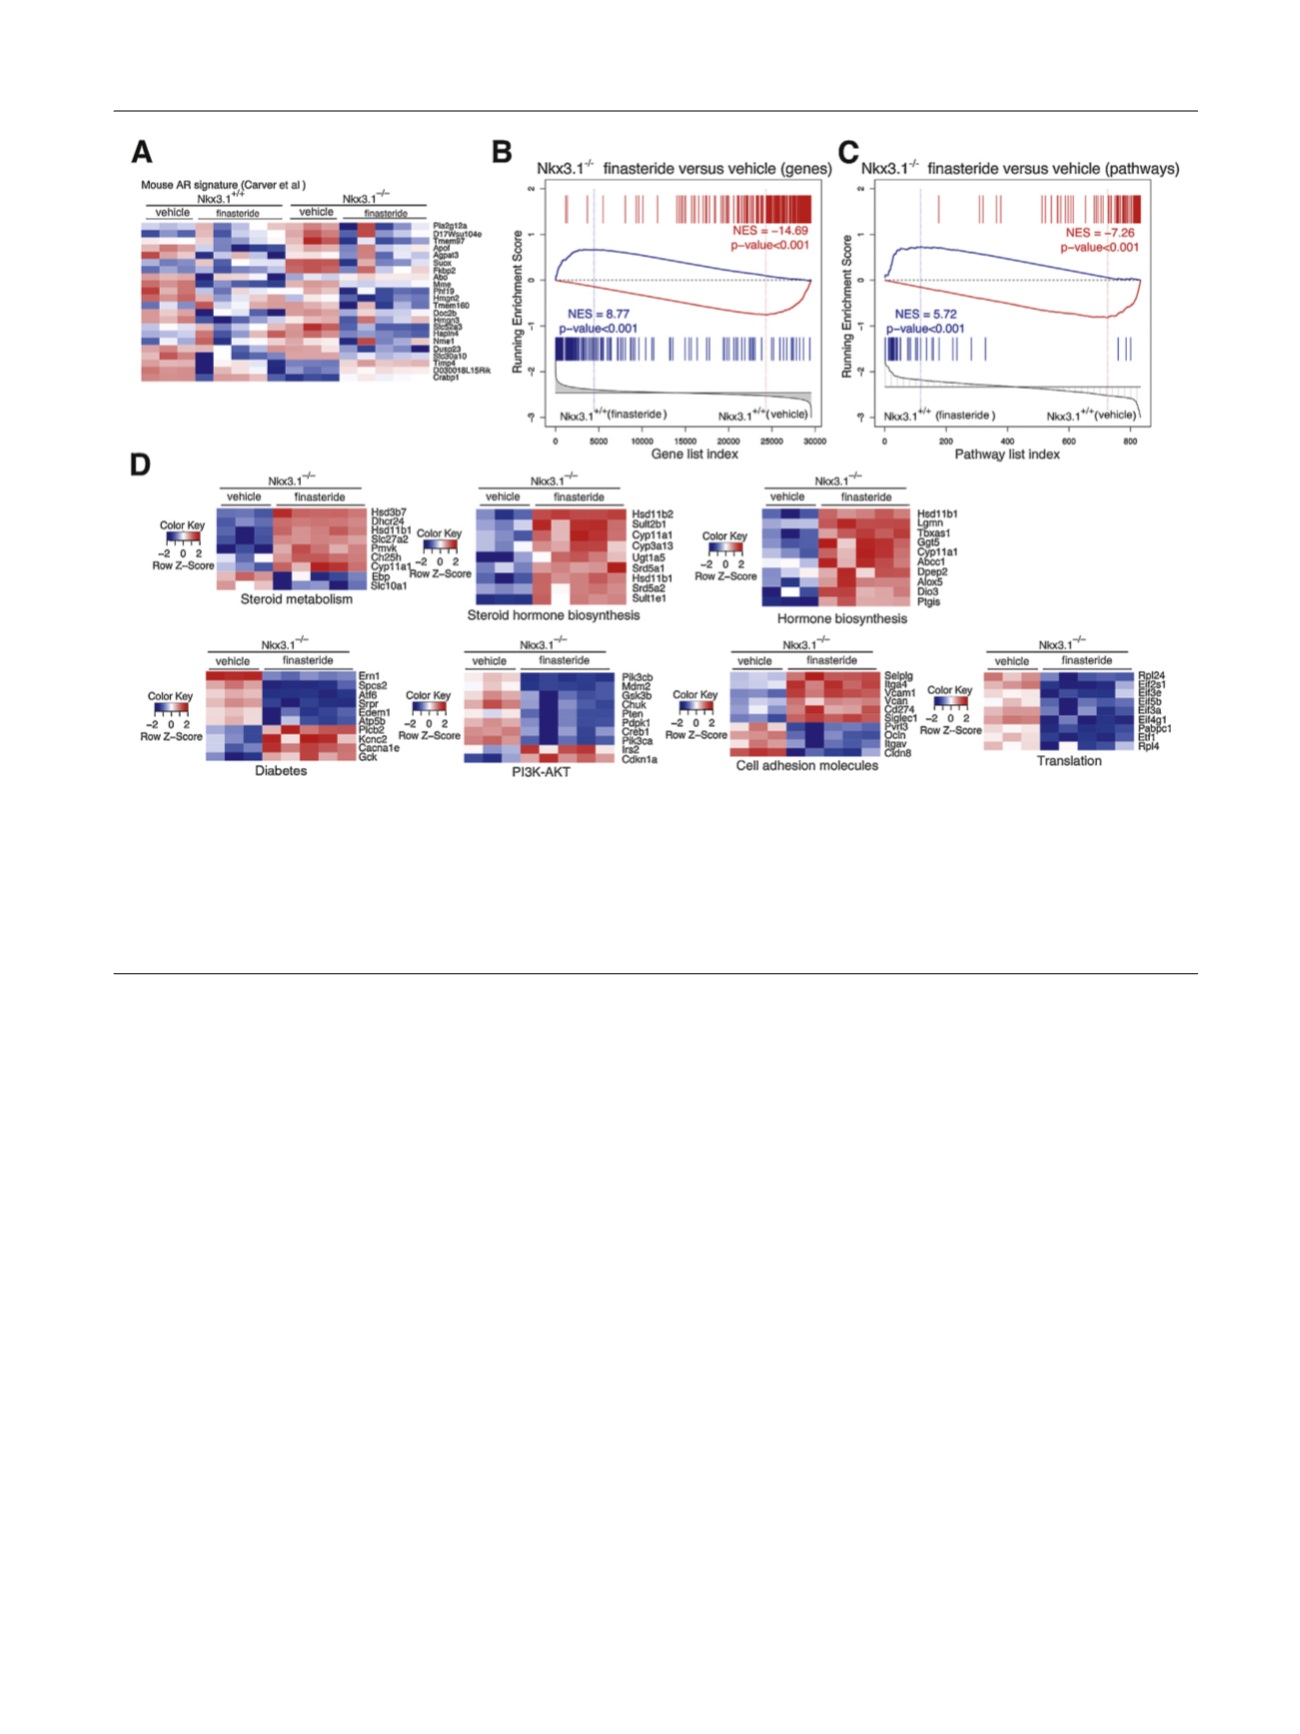
[(Fig._2)TD$FIG]
Fig. 2 – Finasteride leads to reversal of the molecular phenotype of
Nkx3.1
mutant mice. (A) Heat map depicting gene expression levels of AR-regulated
genes reported by Carver et al
[27]comparing vehicle- or finasteride-treated
Nkx3.1
+/+
[8_TD$DIFF]
or
Nkx3.1
S
/
S
prostate, as indicated. (B) Gene set enrichment
analysis (GSEA) comparing a reference gene expression signature from prostates of
Nkx3.1
+/+
finasteride-treated mice (
n
= 5) versus
Nkx3.1
+/+
vehicle-
treated mice (
n
= 3) with a query signature (
p
< 10
S
7
) of
Nkx3.1
S
/
S
finasteride-treated mice (
n
= 5) versus
Nkx3.1
S
/
S
vehicle-treated mice (
n
= 3). (C)
GSEA comparing a reference pathway signature from prostates of
Nkx3.1
+/+
finasteride-treated mice (
n
= 5) versus
Nkx3.1
+/+
vehicle-treated mice (
n
= 3)
with a query pathway signature (top 50 differentially changed pathways) of
Nkx3.1
S
/
S
finasteride-treated mice (
n
= 5) versus
Nkx3.1
S
/
S
vehicle-treated
mice (
n
= 3). (D) Heat maps depicting expression levels of selected leading edge genes from the pathways in (C) from the C2 database, comparing
Nkx3.1
S
/
S
mice treated with vehicle or finasteride.
E U R O P E A N U R O L O G Y 7 2 ( 2 0 1 7 ) 4 9 9 – 5 0 6
503