


 512 656

Importantly, as the assay was trained against a distinct
molecular subgroup rather than clinical outcome, there was
a bimodal distribution of scores (Supplementary Fig. 5). The
metastatic assay gene list and weightings are listed in
Supplementary Table 13.
3.4.
Metastatic assay performance in public datasets
The assay was applied to three independent public prostate
cancer resection gene expression datasets. Assay scores
were calculated using the PLS model and dichotomised into
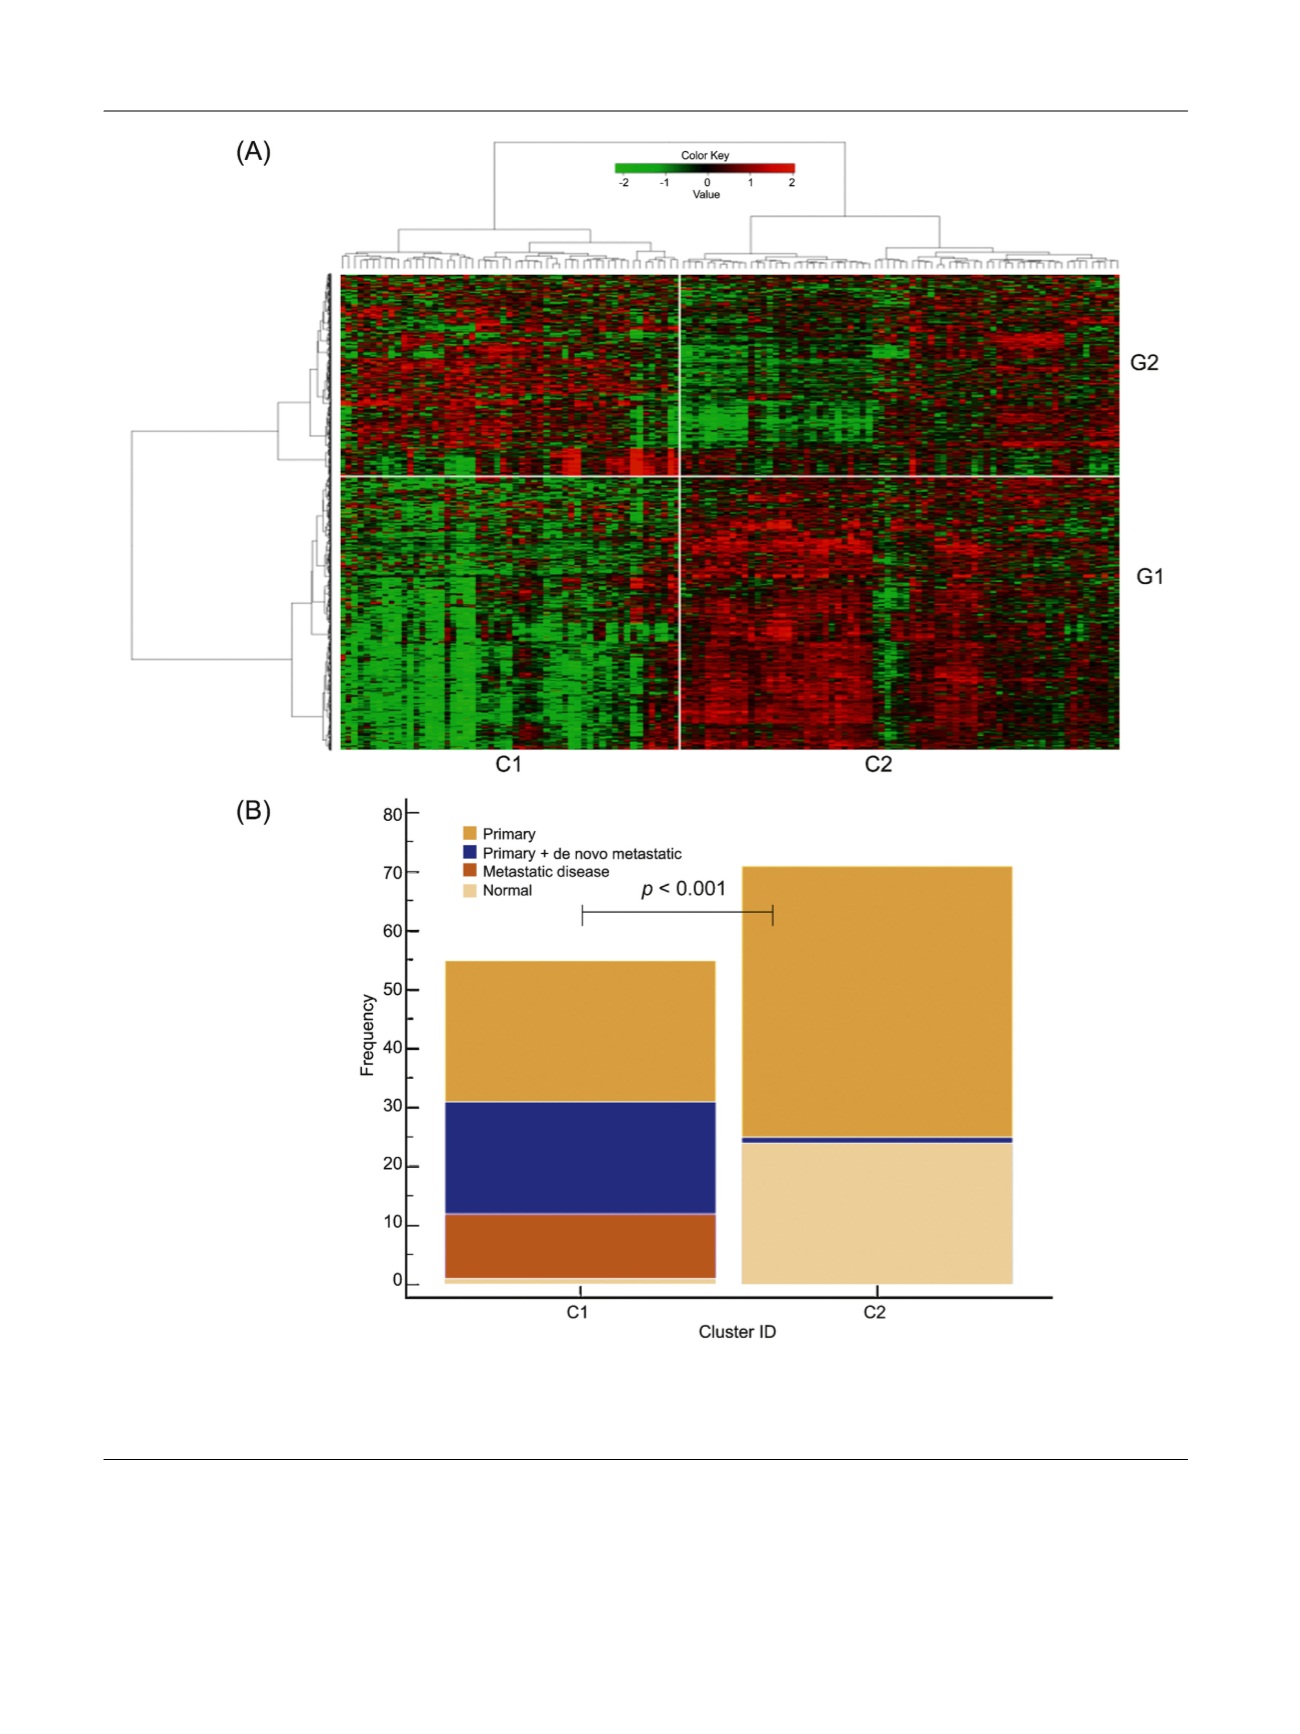
[(Fig._1)TD$FIG]
Fig. 1 – Molecular subtyping and identification of the metastatic subgroup. (A) Hierarchical clustering of transcriptional profiles from the discovery
cohort. Specific genes that are upregulated (red) or downregulated (green) are labelled on the vertical axis within gene clusters. Sample cluster C1
represents the ‘‘metastatic subgroup’’ characterised by a shutdown of gene expression (G1) compared with sample cluster C2. (B) Bar chart
representing the number and type of each tumour mapping to each of the two identified sample clusters within the discovery cohort.
E U R O P E A N U R O L O G Y 7 2 ( 2 0 1 7 ) 5 0 9 – 5 1 8
512