


 514 656

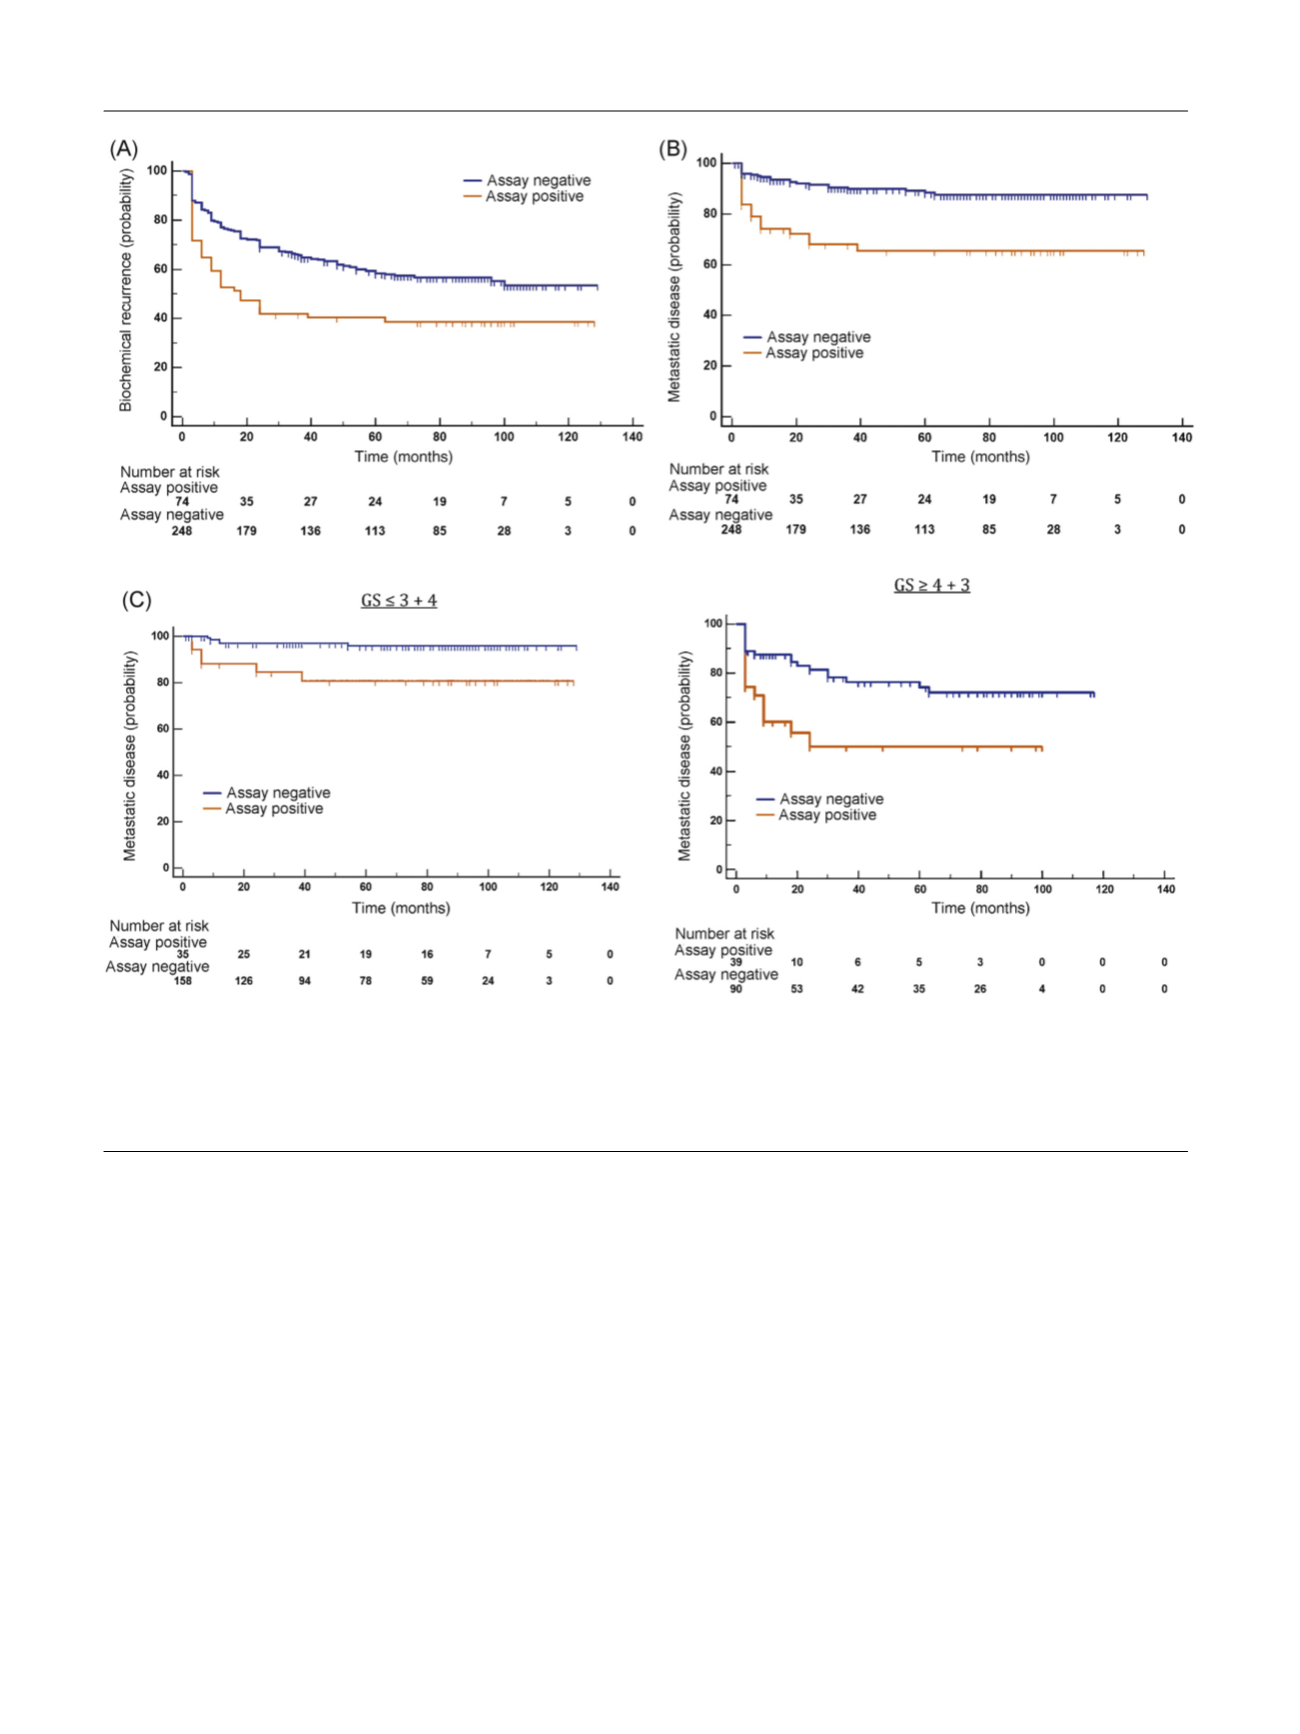 Fig. 3
A and
Table 2) and metastatic recurrence
(HR = 3.20 [1.76–5.80];
p
= 0.0001;
Fig. 3B and
Table 2).
Although the assay was designed to provide information as a
dichotomous result, it was also an independent predictor of
both biochemical and metastatic recurrence when assessed
as a continuous variable in multivariate analysis
(HR = 1.16 [1.03–1.30];
p
= 0.0155 and HR = 1.52 [1.24–
1.85];
p
<
0.0001 [per 0.1 unit change in assay score];
Supplementary Table 15).
3.6.
Comparison of the metastatic assay with clinical risk
stratification
To test assay independence from approaches used in the
clinic, we assessed its performance within risk groups
defined by GS and the CAPRA-S model in the independent
resection validation cohort. When separated by Gleason
(high-risk GS 4 + 3 and low-risk GS 3 + 4), the metastatic
assay identified patients at higher risk of metastatic
recurrence with an HR of 2.43 (1.14–5.17;
p
= 0.0036)
and HR of 5.61 (1.19–26.47;
p
= 0.0013) in the high- and
low-risk GS groups, respectively
( Fig. 3 C).
The CAPRA-S prognostic model uses PSA at presentation,
age, GS, T-stage, seminal vesicle invasion, extracapsular
extension, lymph node invasion, and surgical margins
[13]. In a multivariable analysis adjusted for CAPRA-S, both
the metastatic assay and the CAPRA-S were significantly
associated with biochemical recurrence (HR = 1.72 [1.19–
2.48];
p
= 0.0042 and HR = 2.52 [1.79–3.54];
p
<
0.0001)
and development of metastatic disease (HR = 2.94 [1.60–
5.40];
p
= 0.0005 and HR = 4.76 [2.46–9.23];
p
<
0.0001;
Table 2 ). Given the independence of the metastatic assay
result and CAPRA-S score, a combined model was assessed.
Patients classified within the high-risk subgroup
[7_TD$DIFF]
were
[(Fig._3)TD$FIG]
Fig. 3 – Validation of the metastatic assay in the retrospective independent resection validation dataset. Kaplan–Meier survival analysis for association
of the metastatic assay at predicting (A) time to biochemical recurrence and (B) metastatic
[8_TD$DIFF]
recurrence in the resection validation cohort. Survival
probability (%) showed reduced progression-free survival in months of the ‘‘assay positive’’ (
[9_TD$DIFF]
orange) of 74 patients when compared with the ‘‘assay
negative’’ (blue) of 248 patients for biochemical and metastatic
[12_TD$DIFF]
disease respectively (HR = 1.76 [1.18–2.64];
p
= 0.0008 and HR = 3.47 [1.70–7.07];
p
< 0.0001, respectively). (C) Association of the metastatic assay at predicting metastatic
[8_TD$DIFF]
recurrence stratified into low-risk (GS
=
3 + 4) and high-risk
(GS
I
4 + 3) tumours (HR = 5.61 [1.19–26.47];
p
= 0.0013 and HR = 2.43 [1.14–5.17];
p
= 0.0036 respectively). GS = Gleason score; HR = hazard ratio.
E U R O P E A N U R O L O G Y 7 2 ( 2 0 1 7 ) 5 0 9 – 5 1 8
514