


 515 656

significantly associated with both biochemical and meta-
static recurrence (HR = 2.67 [1.90–3.75];
p
<
0.0001 and
HR = 7.53 [4.13–13.73];
p
<
0.0001, respectively), demon-
strating superiority to either model alone
( Fig. 4and
Table 2,
combined model).
To assess the clinical impact of the combined model of
metastatic assay plus CAPRA-S, additional performance
metrics were assessed for the metastatic
[50_TD$DIFF]
endpoint in the
independent resection validation cohort. As the assay was
dichotomous, the comparison of sensitivity and specificity
between the metastatic assay alone, CAPRA-S alone, and the
combined model were investigated. Whilst the sensitivity
of CAPRA-S (70.5%) was greater than that of the metastatic
assay alone (47.7%), there was an increase in sensitivity to
80.1% in the combined model. There was, however, a
decrease in specificity from 81.9% (metastatic assay) and
71.5% (CAPRA-S) to 61.1% in the combined model, which
may indicate patients who have not yet experienced
recurrence within the 50.3-
[34_TD$DIFF]
months median follow-up
(Supplementary Table 16).
Assessment as a continuous predictor using AUC and
decision curve analysis demonstrated an improvement in
discrimination power of metastatic events and a greater net
benefit for the combined model at a representative risk
[(Fig._4)TD$FIG]
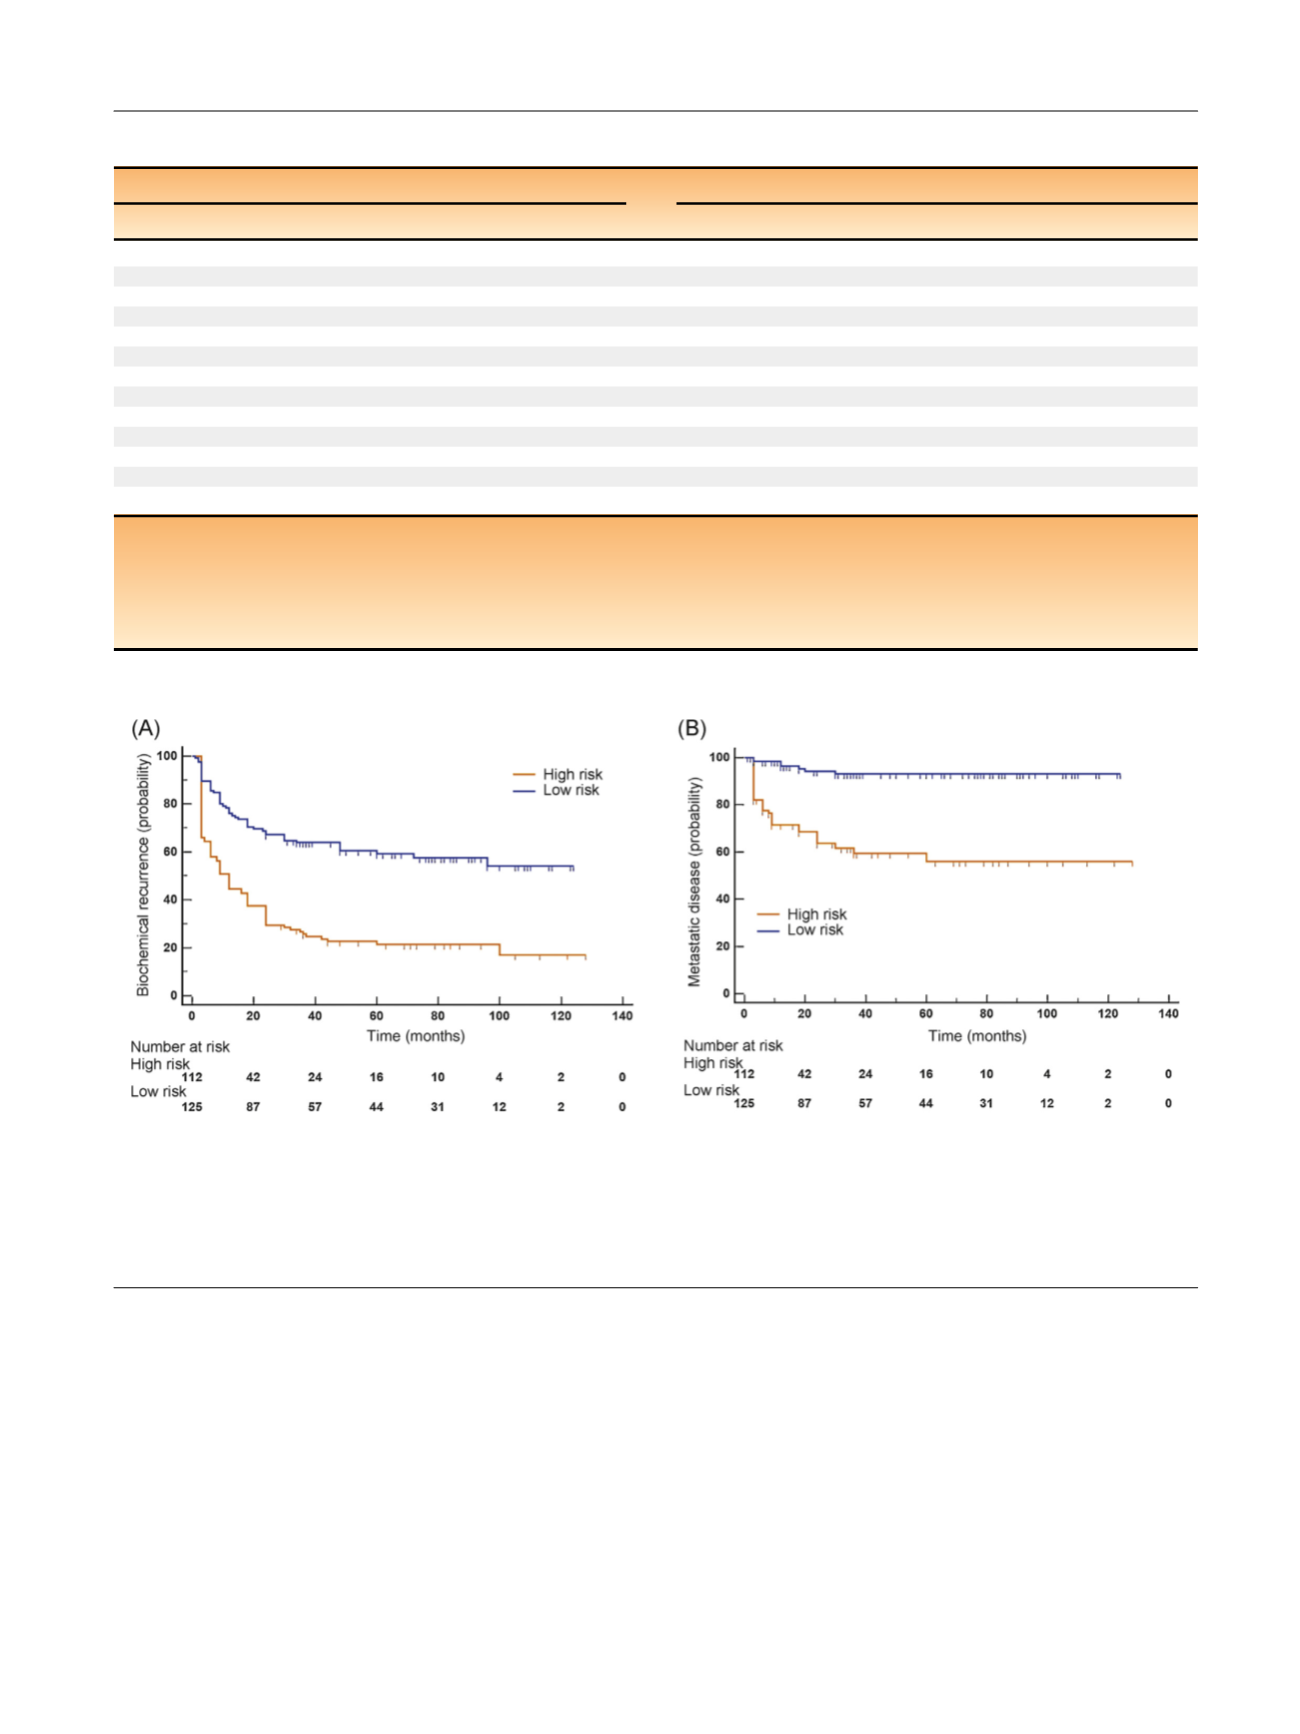
Fig. 4 – Validation of the metastatic assay in resections using a combined model with CAPRA-S to stratify high and low risk. (A) Association of a
combined model (metastatic assay + CAPRA-S) at predicting time to biochemical recurrence of high/low-risk disease in the resection cohort. Reduced
progression-free survival in months of the ‘‘high-risk’’ subgroup (
[9_TD$DIFF]
orange) of 112 patients when compared with the ‘‘low-risk’’ subgroup (blue) of
125 patients (HR = 2.67 [1.90–3.75];
p
< 0.0001). (B) Association of a combined model (metastatic assay + CAPRA-S) at predicting time to metastatic
disease
[8_TD$DIFF]
recurrence of high/low-risk disease in the resection cohort. Reduced progression-free survival in months of the ‘‘high-risk’’ subgroup (
[9_TD$DIFF]
orange)
of 112 patients compared with the ‘‘low-risk’’ subgroup (blue) of 125 patients (HR = 7.53 [4.13–13.73];
p
< 0.0001). CAPRA-S = Cancer of the Prostate
Risk Assessment postsurgical; HR = hazard ratio.
Table 2 – Validation of metastatic assay in the independent resection validation dataset
Biochemical recurrence
Metastatic recurrence
Covariate
HR
95% CI
p
Covariate
HR
95% CI
p
Multivariate model 1
Multivariate model 1
Metastatic assay
1.62
1.13–2.33
0.0092
Metastatic assay
3.20
1.76–5.80
0.0001
Gleason (3 + 4)
Gleason (3 + 4)
<
7
0.76
0.44–1.30
0.3224
<
7
0.72
0.19–2.73
0.6358
4 + 3
1.95
1.29–2.95
0.0017
4 + 3
4.33
1.89–9.93
0.0006
8–10
2.79
1.82–4.30
<
0.0001
8–10
6.85
2.92–16.04
<
0.0001
Age
1.00
0.97–1.03
0.9027
Age
0.97
0.92–1.02
0.2828
PSA
1.01
1.00–1.01
0.0321
PSA
1.00
0.99–1.01
0.6423
Multivariate model 2
Multivariate model 2
Metastatic assay
1.72
1.19–2.48
0.0042
Metastatic assay
2.94
1.60–5.40
0.0005
CAPRA-S
2.52
1.79–3.54
<
0.0001
CAPRA-S
4.76
2.46–9.23
<
0.0001
Combined model
Combined model
Metastatic assay + CAPRA-S
2.67
1.90–3.75
<
0.0001
Metastatic assay + CAPRA-S
7.53
4.13–13.73
<
0.0001
HR = hazard ratio; CI = confidence intervals; PSA = prostate-specific antigen; CAPRA-S = Cancer of the Prostate Risk Assessment postsurgical.
Multivariable analysis of the metastatic assay in the independent resection validation cohort for biochemical recurrence (right) and metastatic
[8_TD$DIFF]
recurrence (left),
p
values, HRs and 95% CIs of the HR are outlined within the table (multivariate model 1). Covariate analysis of the metastatic assay adjusting for CAPRA-S within
the independent resection validation cohort is also included with
p
values, HRs and 95% CIs of the HR outlined (multivariate model 2). Analysis from a
combined model of the metastatic assay and CAPRA-S within the independent resection validation cohort was also assessed, outlining
p
values, HRs, and
[16_TD$DIFF]
95%
CIs for biochemical and metastatic disease
[8_TD$DIFF]
recurrence (combined model).
E U R O P E A N U R O L O G Y 7 2 ( 2 0 1 7 ) 5 0 9 – 5 1 8
515