


 513 656

assay positive and assay negative. In the first (
n
= 79)
[21],
the assay was significantly associated with biochemical
recurrence with a sensitivity of 70.3% and specificity of 66.7%
(chi-square
p
= 0.0049). In a second (
n
= 545)
[17] ,the assay
was significantly associated with metastatic
[8_TD$DIFF]
recurrence with
a sensitivity of 67.0% and specificity of 54.6% (chi-square
p
<
0.0001) (Supplementary Table 14). Using a third dataset
with time to event data (
n
= 126)
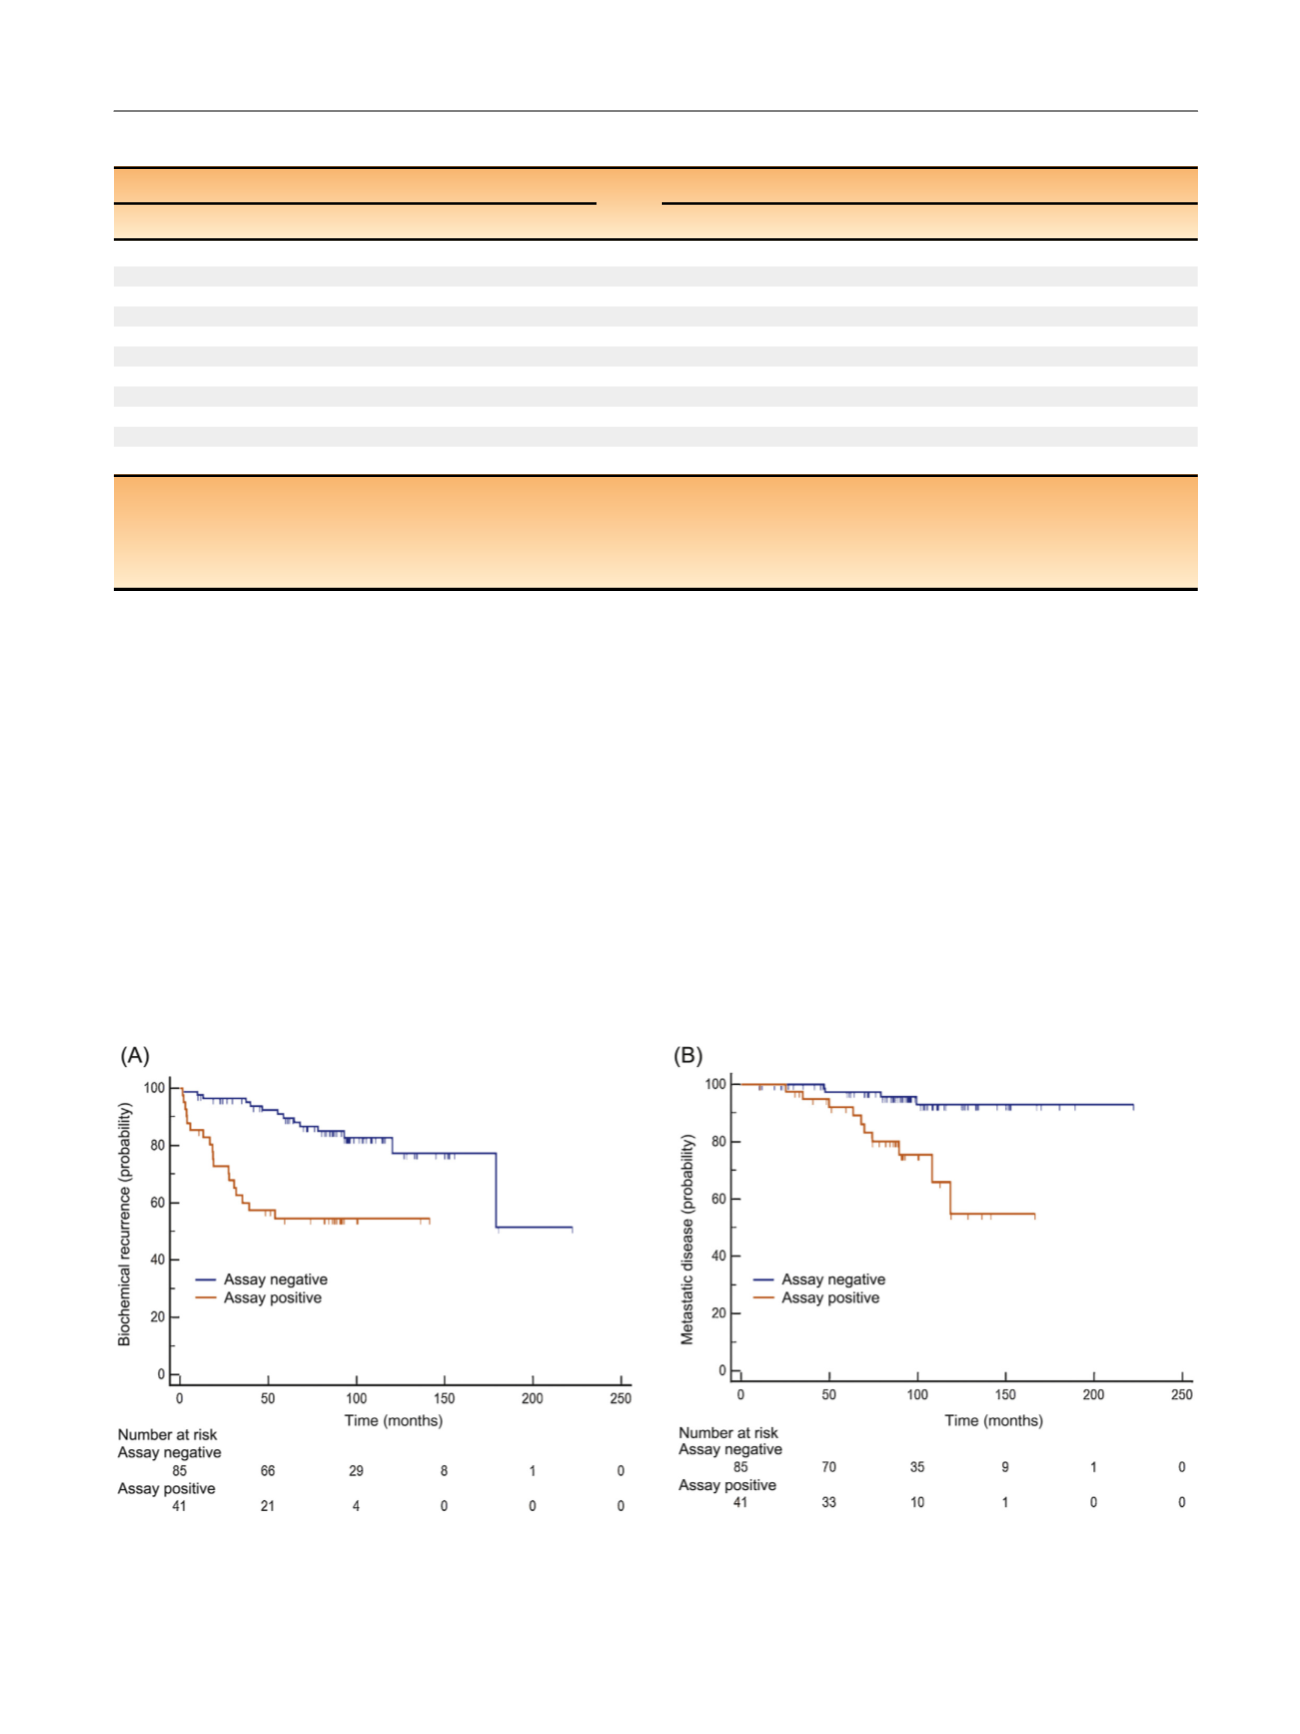
[22] ,multivariable analysis
adjusting for Gleason (grades represented in four sub-
groups), age, and PSA demonstrated an increased risk of
biochemical recurrence (hazard ratio [HR] = 3.03 [1.43–
6.41];
p
= 0.0040;
Table 1and
Fig. 2 A). However, possibly
due to the small number of metastatic events (11%), the
association with outcome in multivariable analysis did not
reach statistical significance (HR = 2.53 [0.67–9.54];
p
= 0.1735;
Table 1and
Fig. 2B).
3.5.
Metastatic assay performance in an independent primary
prostate cancer resection dataset
The assay was then applied to 322 FFPE prostatectomy
samples from four clinical sites with a median follow-up of
50.3
[34_TD$DIFF]
months using predefined inclusion/exclusion criteria
per REMARK guidelines (Supplementary Fig. 1). A predefined
assay cut-off of 0.3613 was used to define metastatic assay
positivity in a blinded manner. On multivariable analysis, a
positive assay result was associated with an increased risk of
biochemical recurrence (HR = 1.62 [1.13–2.33];
p
= 0.0092;
Table 1 – Validation of metastatic assay in the
[13_TD$DIFF]
Memorial Sloan Kettering Cancer Centre
[14_TD$DIFF]
(MSKCC
[15_TD$DIFF]
) cohort
Biochemical recurrence
Metastatic recurrence
Covariate
HR
95% CI
p
Covariate
HR
95% CI
p
Multivariate model 1
Multivariate model 1
Metastatic assay
3.03
1.43–6.41
0.0040
Metastatic assay
2.53
0.67–9.54
0.1735
Gleason (3 + 4)
Gleason (3 + 4)
a<
7
0.38
0.10–1.37
0.1409
<
7
0.00
0.00
0.9658
4 + 3
2.04
0.76–5.43
0.1579
4 + 3
22.61
2.34–218.06
0.0073
8–10
8.09
2.74–23.91
0.0002
8–10
187.79
16.52–2134.99
<
0.0001
Age
0.99
0.94–1.04
0.6564
Age
0.88
0.80–0.97
0.0110
PSA
1.00
0.96–1.04
0.9857
PSA
0.94
0.89–0.98
0.0106
Multivariate model 2
Multivariate model 2
Metastatic assay
3.35
1.62–6.94
0.0012
Metastatic assay
3.95
1.15–13.53
0.0298
CAPRA-S
3.92
1.92–7.99
0.0002
CAPRA-S
3.50
1.13–10.80
0.0302
HR = hazard ratio; CI = confidence intervals; PSA = prostate-specific antigen; CAPRA-S = Cancer of the Prostate Risk Assessment postsurgical.
Multivariable analysis of the MSKCC cohort for biochemical recurrence (right) and metastatic recurrence (left),
p
values, HRs and 95% CIs of the HR are outlined
within the table (multivariate model 1). Covariate analysis of the metastatic assay adjusting for CAPRA-S within the MSKCC cohort is also included with
p
values, HRs and 95% CIs
[2_TD$DIFF]
of the HR are outlined (multivariate model 2).
a
Absence of metastatic events in patients with Gleason score
<
3 + 4.
[(Fig._2)TD$FIG]
[1_TD$DIFF]
Fig. 2 – Validation of the metastatic assay in resections using the MSKCC
in silico
dataset. Kaplan–Meier survival analysis for association of the
metastatic assay at predicting (A) time to biochemical recurrence and (B) metastatic
[8_TD$DIFF]
recurrence in the MSKCC
in silico
cohort. Survival probability (%)
showed reduced progression-free survival in months of the ‘‘assay positive’’ (
[9_TD$DIFF]
orange) of
[10_TD$DIFF]
41 patients when compared with the ‘‘assay negative’’ (blue) of
[11_TD$DIFF]
85 patients for biochemical and metastatic
[12_TD$DIFF]
disease respectively (HR = 3.76 [1.70–8.34];
p
< 0.0001 and HR = 6.00 [1.90–18.91];
p
= 0.0005, respectively).
HR = hazard ratio.
E U R O P E A N U R O L O G Y 7 2 ( 2 0 1 7 ) 5 0 9 – 5 1 8
513