


 550 656

dataset that combined patients from TCGA, MDA, and the
University of Lund datasets (
n
= 476). We validated the
relative changes in outcome by GSC subtype in patients
treated with and without NAC
( Fig. 4A). Patients with GSC
basal tumors had a 3-yr OS rate of 49.2% (95% confidence
interval [CI] 39.5–61.2%;
p
<
0.001) in the non-NAC cohort
compared with 77.8% (95% CI 67.2–90.0%;
p
<
0.001) in the
NAC cohort.
had the worst outcome, the prognosis of patients with basal tumors significantly improved when treated with NAC. (B) OS stratified according to the
MDA subtypes. Patients with MDA luminal tumors had the best outcome in both the non-NAC (left) and NAC (right) settings. In the presence of NAC,
patients with p53-like tumors had a significantly shorter OS when compared with patients with MDA luminal tumors. (C) OS stratified according to
the TCGA clusters. Clusters I and II clearly subdivide luminal tumors into two subsets—a subset with good prognosis (cluster I) and a subset with poor
prognosis (cluster II)—although neither was affected by NAC. Basal tumors were subdivided into two subsets with similar prognosis in the non-NAC
setting, but discrepant responses to NAC. The OS of patients with cluster III tumors was superior when treated with NAC, whereas that of patients with
cluster IV tumors was poor regardless of NAC. (D) OS stratified according to the Lund subtypes. Patients with luminal tumors (Uro A and genomically
unstable) had the best outcome without (left) and with (right) NAC. The OS of patients with basal tumors (Uro B and SCC-like) was inferior to that of
Uro A tumors in the absence of NAC (left). However, with NAC (right) the outcome was similar to that in Uro A patients. The
p
values represent Cox
proportional hazard ratios. MDA = MD Anderson Cancer Center; NAC = neoadjuvant chemotherapy; OS = overall survival; SCC = squamous cell
carcinoma; TCGA = The Cancer Genome Atlas; UNC = University of North Carolina; Uro = urobasal.
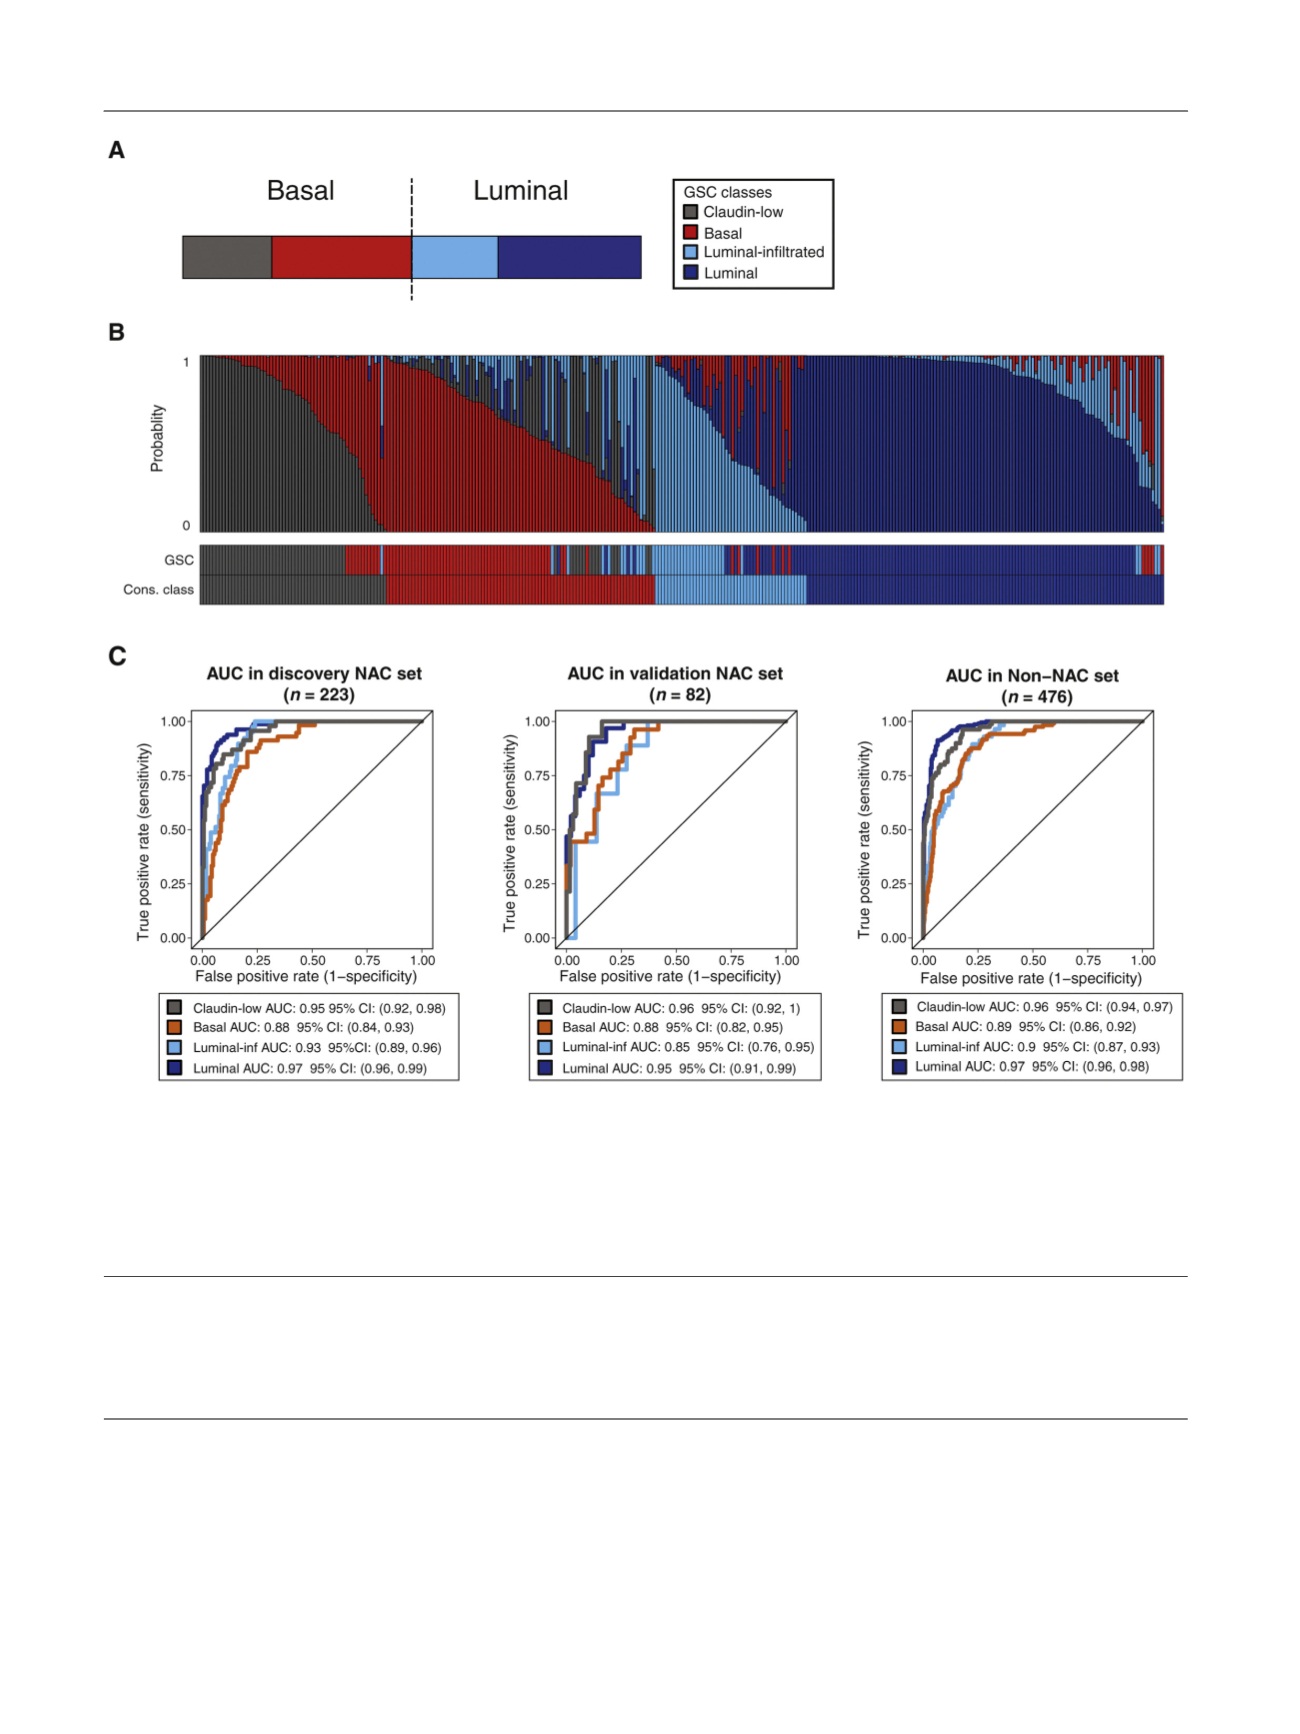
[(Fig._3)TD$FIG]
Fig. 3 – Discovery and validation of the GSC. (A) Proposed GSC bladder cancer classes derived from a consensus of four models (UNC, MDA, TCGA, and
Lund). Colors indicate each class: claudin-low (gray), basal (red), luminal-infiltrated (light blue), and luminal (dark blue). (B) GSC cross-validation
scores for each sample in the NAC dataset. The vertical bands represent the probability of each sample belonging to each class. The bottom bars
indicate the classes predicted by GSC as well as the consensus classes. (C) Performance of the GSC in the discovery (10-fold cross validation for model
performance) and two independent validation cohorts (NAC validation cohort and non-NAC validation cohort). Across all the cohorts, GSC was able to
predict all subtypes significantly with a high area under the curve (compared with consensus classes). AUC = area under the curve; CI = confidence
interval; Cons. = consensus; GSC = genomic subtyping classifier; inf = infiltrated; MDA = MD Anderson Cancer Center; NAC = neoadjuvant chemotherapy;
TCGA = The Cancer Genome Atlas; UNC = University of North Carolina.
E U R O P E A N U R O L O G Y 7 2 ( 2 0 1 7 ) 5 4 4 – 5 5 4
550