


 551 656

[(Fig._4)TD$FIG]
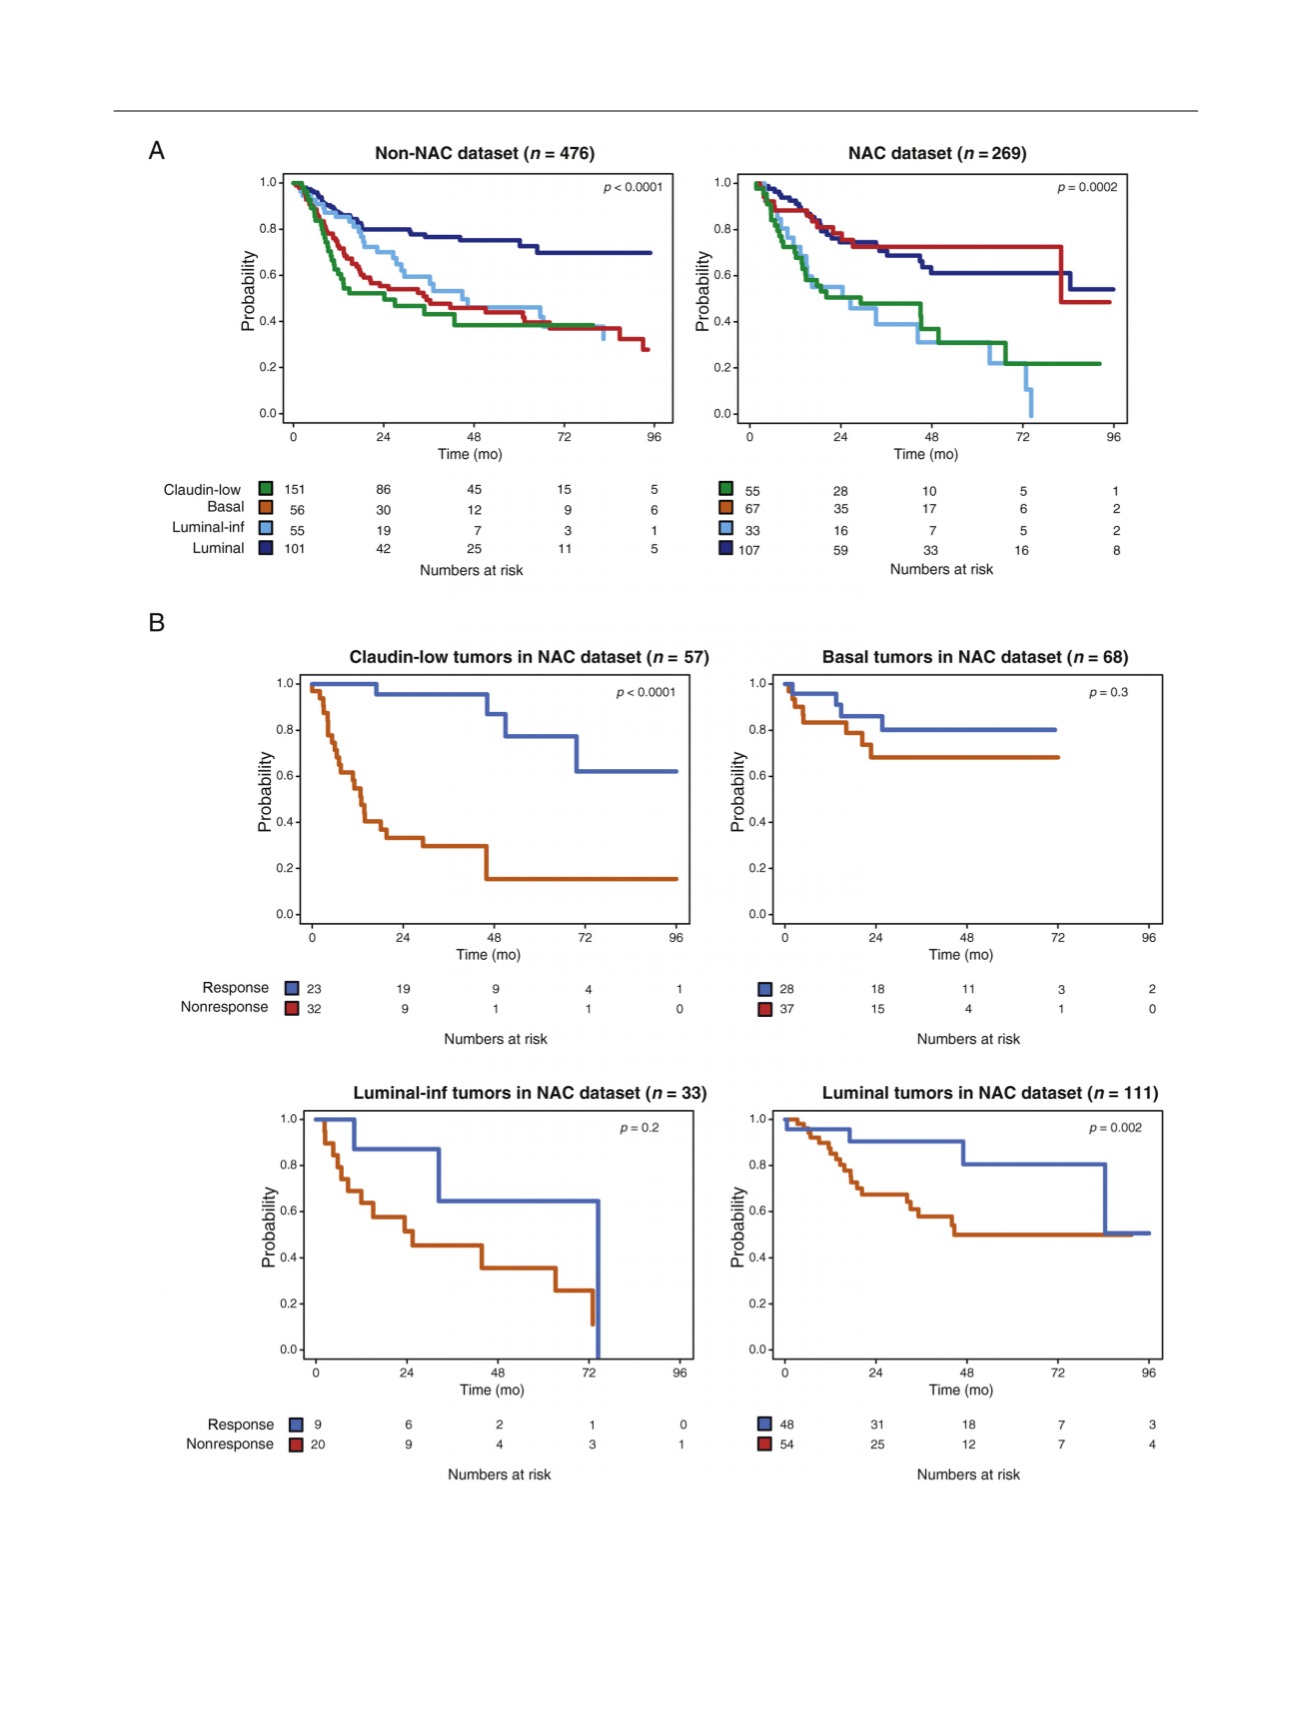
Fig. 4 – Clinical significance of GSC with and without cisplatin-based NAC. (A) Kaplan–Meier plots for OS in non-NAC (left) and NAC (right) datasets
stratified according to the classes predicted by GSC. (B) OS of the NAC dataset according to major pathological downstaging stratified by claudin-low
(upper left), basal (upper right), luminal-infiltrated (lower left), and luminal (lower right) subtypes. GSC = genomic subtyping classifier; inf = infiltrated;
NAC = neoadjuvant chemotherapy; OS = overall survival.
E U R O P E A N U R O L O G Y 7 2 ( 2 0 1 7 ) 5 4 4 – 5 5 4
551