


 647 656

SH3KBP1 was highly elevated in the patient harboring the
fusion in comparison to the other patients.
4.
Discussion
This is the first comprehensive, integrated genomic analysis
of UTUC. Procurement of sufficient banked samples of this
rare disease required pooling from two different institu-
tions, and harmonization of clinical and genomic data. From
the merged WES data set we identified 2784 mutations,
with
FGFR3
the most commonly mutated gene (74%) in both
low-grade (92%) and high-grade (60%) tumors. The rela-
tively high rate of
FGFR3
mutations in high-grade tumors is
nearly double the rate previously reported
[11]. The
APOBEC mutation signature seen in 45% of patients is part
of the DNA repair pathway and may explain the high
mutation rates in patients with
ERCC2
mutation.
Comparison of mutational profiles for low- and high-
grade tumors revealed a significantly higher occurrence of
mutations in the p53 and related interacting pathways in
high-grade tumors, leading to greater genomic instability,
copy number alterations, and disruption of cell-cycle and
apoptotic pathways corroborated by protein analysis.
Using unsupervised consensus clustering of RNAseq
data, we identified four putative molecular subtypes
correlating with relevant clinical variables. These clusters
bear some similarity to the previously described bladder
subtypes
[6] :cluster 1 is similar to the bladder luminal
subtype, cluster 2 is more similar to the basal subtype, and
cluster 4 has a high rate of upregulated immune checkpoint
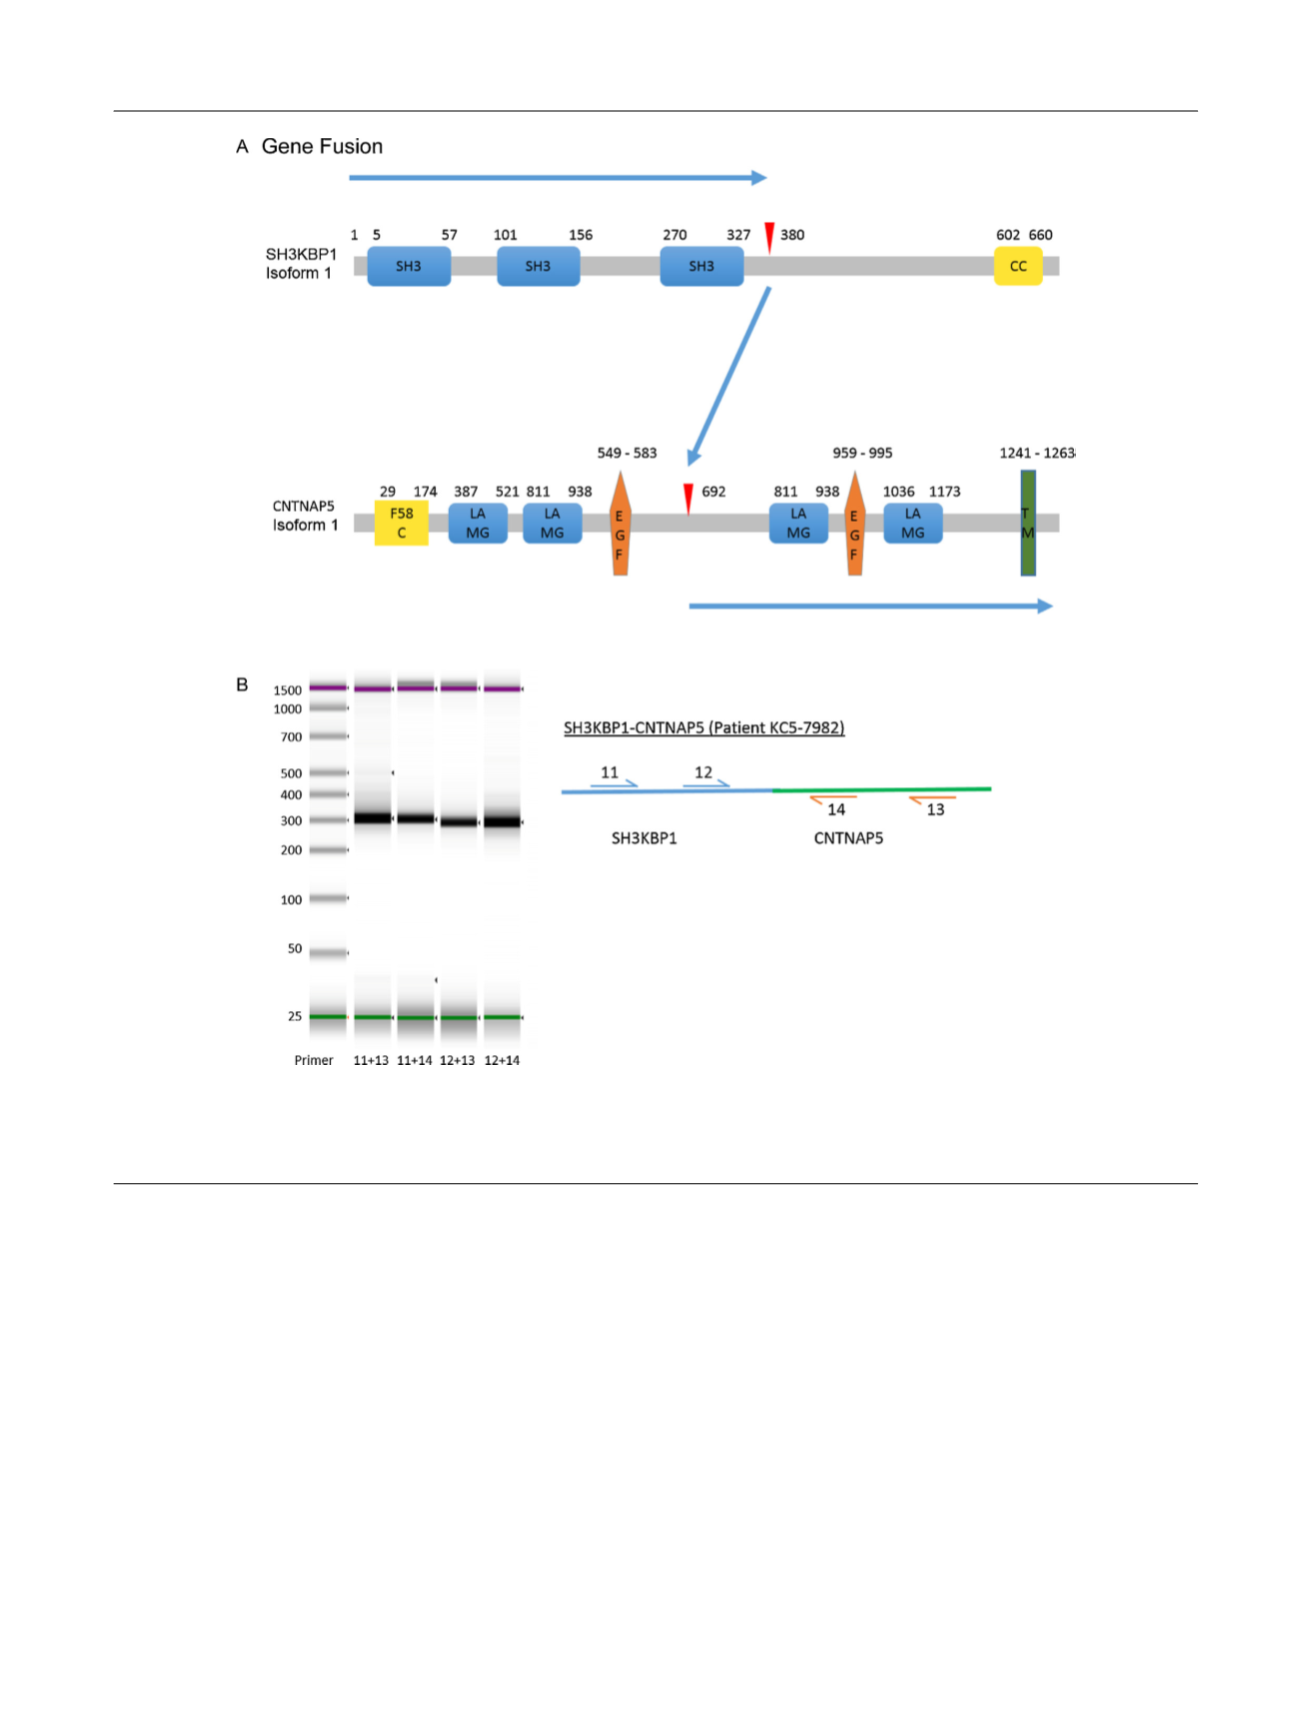
[(Fig._4)TD$FIG]
Fig. 4 – Novel gene fusion. (A) Schematic of SH3KBP1 and CNTNAP5 protein showing domains and position of the breakpoint (red arrowheads) of the
fusion. The blue arrow shows the resulting fusion product. (B) DNA gel image of the polymerase chain reaction products validating the gene fusions.
Forward primers for 5
0
genes and reverse primers for 3
0
genes are indicated by numbers in the schematic, and primer pairs are shown below the gel
image.
E U R O P E A N U R O L O G Y 7 2 ( 2 0 1 7 ) 6 4 1 – 6 4 9
647