


 645 656

Patients assigned to cluster 1 or cluster 2 had zero
recorded events with respect to cancer-specific survival
( Fig. 3c), while patients in cluster 2 had worse overall
survival
( Fig. 3 B).
3.5.
Novel SH3KBP1-CNTNAP5 gene fusion
We identified two fusion transcripts via RNAseq (Supple-
mentary Table 4). RT-PCR using primers spanning the fusion
junctions was performed for each of the predicted fusion
transcripts
( Fig. 4 ), and DNA sequencing validated the
fusion junction. In addition to the previously reported
FGFR3-TACC3
fusion
[11,25], we observed a novel
SH3KBP1-
CNTNAP5
fusion. It has been reported that SH3KBP1, also
known as CIN85 (cbl-interacting protein of 85 kDa),
promotes cancer progression in multiple cancer types,
including colon
[26], breast
[27], and head and neck
[28]cancers. SH3KBP1 is reported to play a role in the regulation
of RTK signaling
[29]. A recent study found that SH3KBP1
acts to recycle TGF
b
receptors
[30]. The expression level of
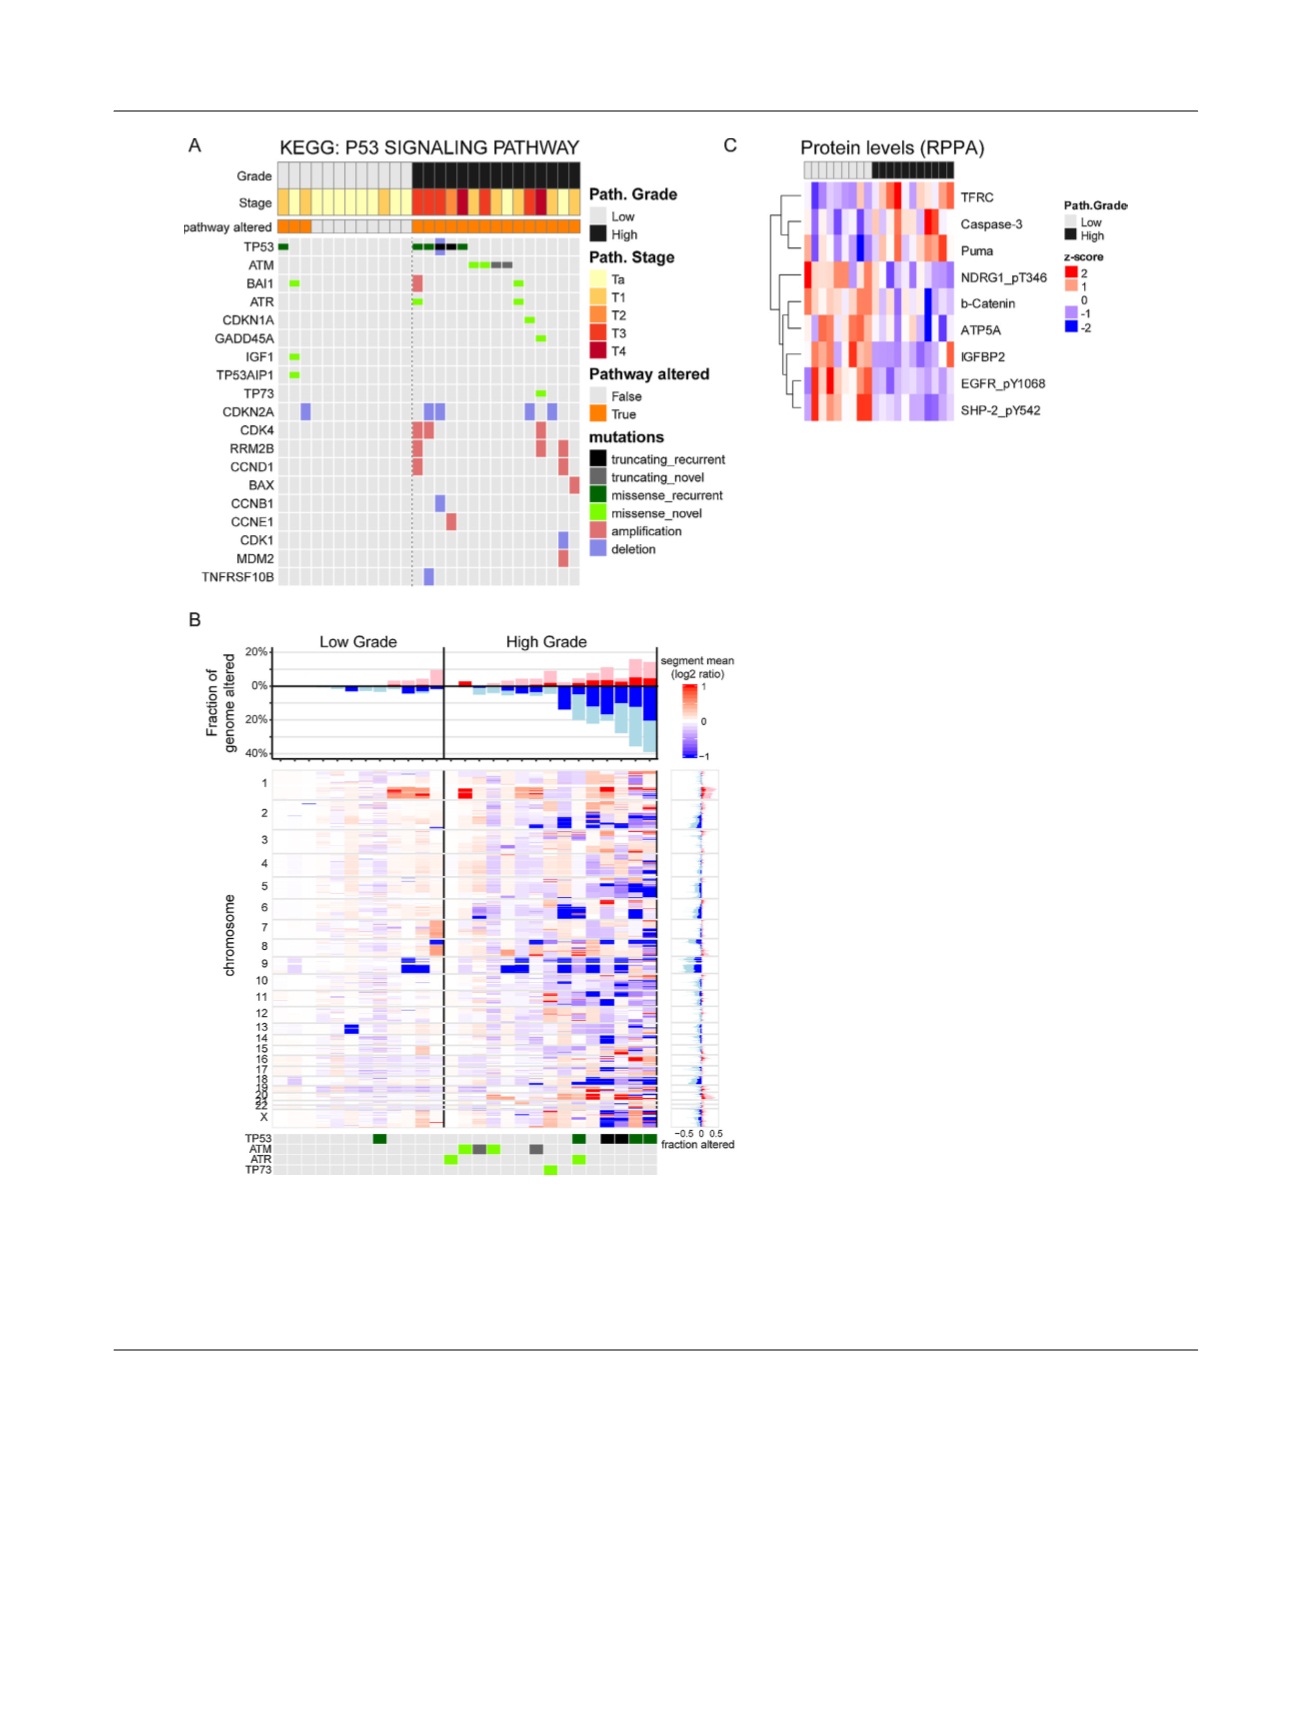
[(Fig._2)TD$FIG]
Fig. 2 – Molecular characteristics of high- and low-grade tumors. (A) Samples with mutations in genes that are components of p53 signaling (KEGG
pathways) are represented by a tile plot. Pathologic grade and stage are indicated by tracks on top, along with a track indicating whether samples
have a mutation in at least one gene in the pathway. (B) Copy number alterations in high- and low-grade samples. The main panel represents the
chromosomal segment, with mean copy number ratios for each sample. The top panel represents the fraction of the genome with copy number gains
(pink), amplification (red), losses (light blue), and deletions (blue) for each sample. The right panel represents the chromosomal segment-wise fraction
of samples with copy number alterations. Mutations in DNA repair genes are indicated in the bottom panel. (C) Relative levels of proteins measured by
reverse-phase protein array (RPPA). Shown are the proteins with significantly different levels (
p
=
0.01) between the high- and low-grade samples.
E U R O P E A N U R O L O G Y 7 2 ( 2 0 1 7 ) 6 4 1 – 6 4 9
645