


 644 656

clinical variables, including tumor pathology grade, stage,
and local or any recurrence
( Fig. 3 , Table 2, and Supplemen-
tary Fig. 7). A Kaplan-Meier plot showed a separation in the
overall survival rate between samples belonging to different
subtypes, but this was not statistically significant, probably
because of the low sample/event numbers
( Fig. 3 ).
Comparing our data set to TCGA data revealed that UTUC
cluster 2 was the most similar to the TCGA basal-like cluster
(Supplementary Fig. 8A). Analysis of individual TCGA
bladder cancer basal and luminal markers revealed signifi-
cant differences between clusters 1 and 2, with higher
expression of basal markers in cluster 2 (KRT4 and TP63)
and higher expression of a luminal marker in cluster 1
(UPK2)
[7](Supplementary Fig. 8B).
Each of the four subtypes had unique molecular and
clinical features. Cluster 1 had no
PIK3CA
mutations;
was enriched for non-smokers, high-grade non–muscle-
invasive tumors, and high recurrence rates; and had
favorable survival. Cluster 2, with 100%
FGFR3
mutations,
was enriched for low-grade, noninvasive disease, and had no
bladder recurrences. Cluster 3 also had 100%
FGFR3
mutations; 71%
PIK3CA
and no
TP53
mutations; and had
high tobacco use and bladder recurrence. The tumors were
all non–muscle-invasive. Cluster 4 had
KMT2D
(62.5%),
FGFR3
(50%), and
TP53
(50%) mutations, but no
PIK3CA
mutations;
and was enriched for high-grade, muscle-invasive disease,
tobacco use, carcinoma in situ, and shorter survival. A novel
SH3KBP1-CNTNAP5
fusion was identified in this cluster
(Section
3.5 ), with high expression levels in the sample.
CTLA4, CD274 (PDL1) and PDCD1 (PD1) have recently
been established as effective targets of immunotherapy in
some cancers
[8,24]. We observed higher mRNA expression
levels of all three genes in 17% of all patients (5/28);
however, they were upregulated in nearly half of the cluster
4 samples (4/9) but not any in of the cluster 3 samples
( Fig. 3 ).
[(Fig._1)TD$FIG]
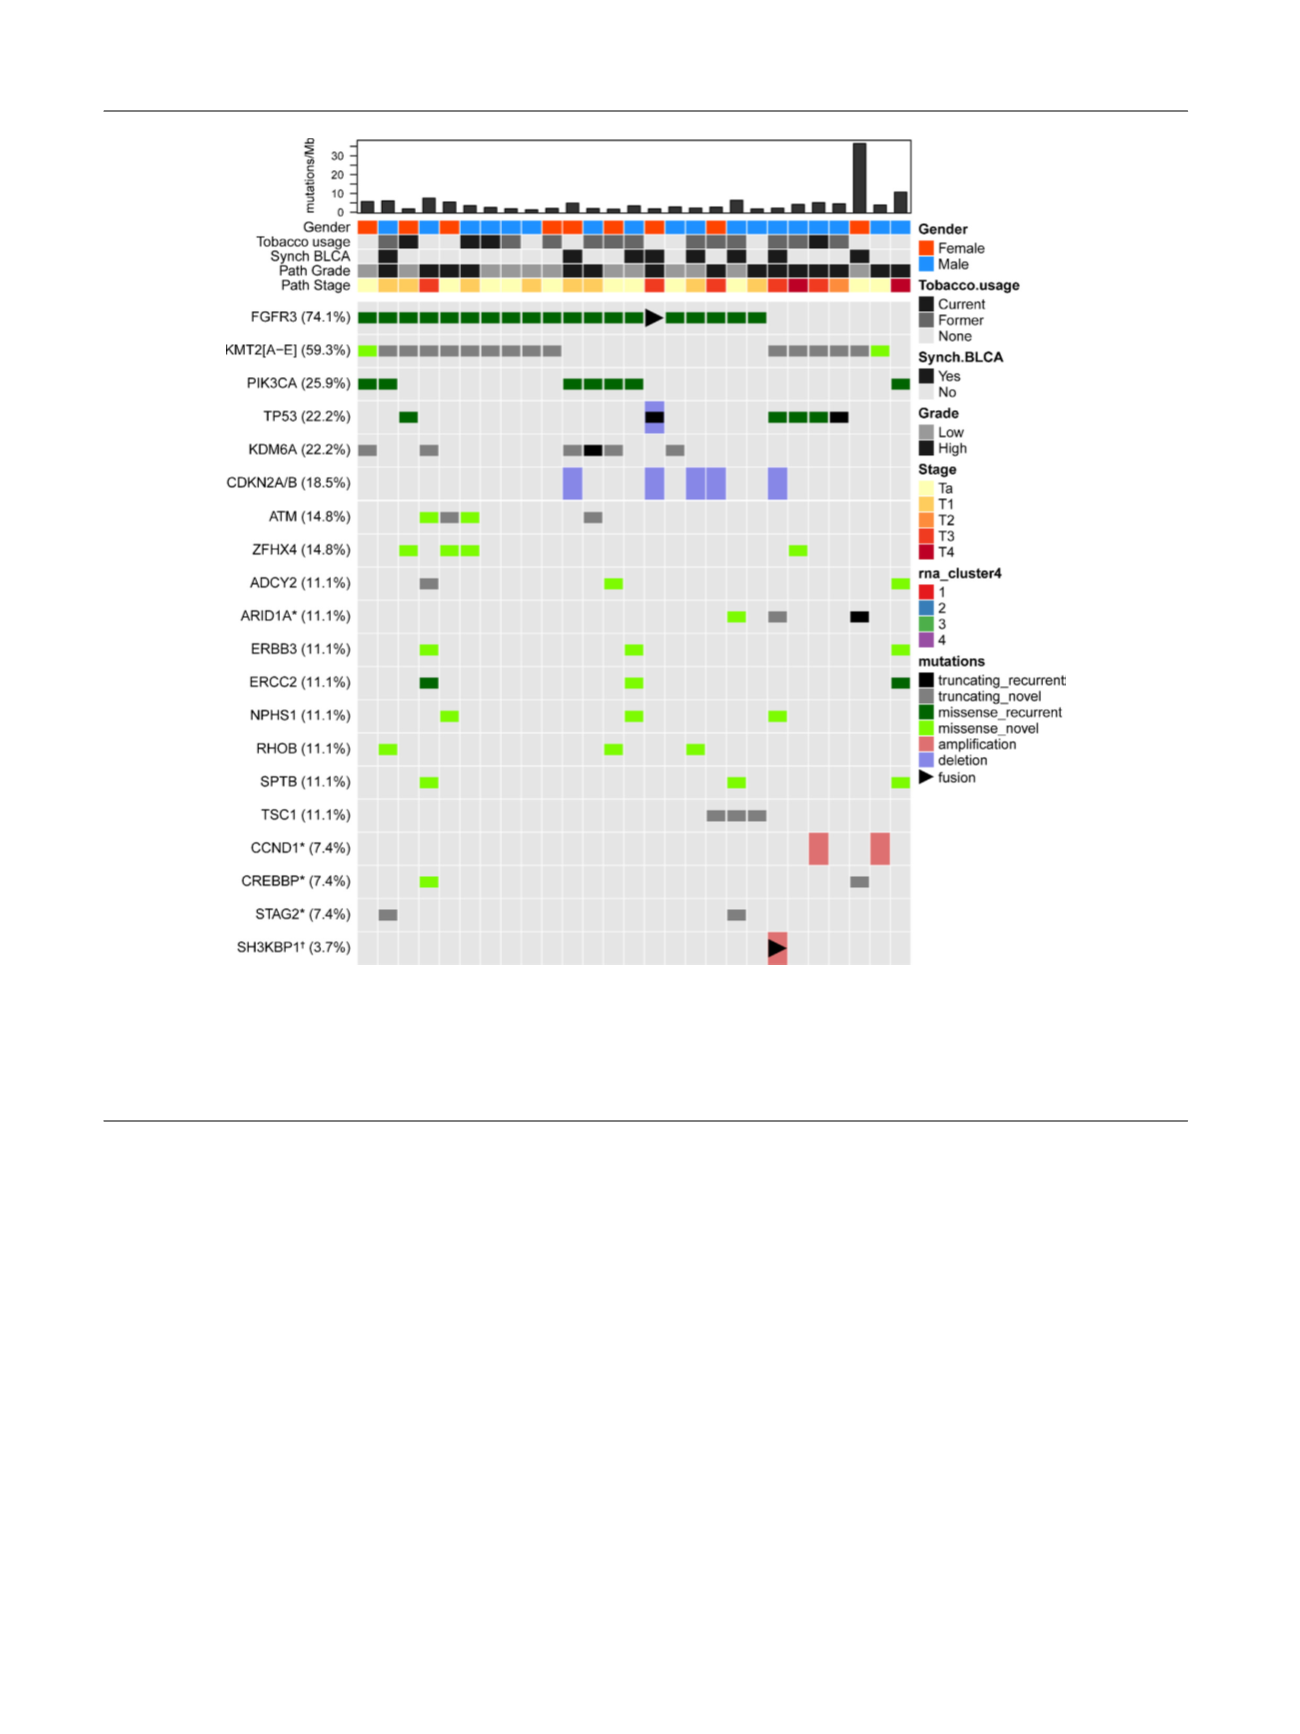
Fig. 1 – Oncoplot of genomic alterations in upper tract urothelial carcinoma (UTUC). The most frequently altered genes in 25 of 27 patients (somatic
mutations in the hypermutator samples were excluded when determining top altered genes) are represented, along with the top mutated genes in
UTUC in previous reports
[11] .Mutations with at least ten reports in COSMIC
[32]are considered recurrent (dark green and black).
TERT
promoter
mutations were detected in two of the five samples for which we obtained sufficient sequence coverage for the
TERT
promoter, and are not shown
here. The somatic mutation rates are represented by barplots (total number of silent and nonsilent mutations per Mb covered by
I
20 reads). Selected
patient/sample clinical features are represented in top tracks. Synch BLCA = synchronous bladder cancer.
E U R O P E A N U R O L O G Y 7 2 ( 2 0 1 7 ) 6 4 1 – 6 4 9
644