


 646 656

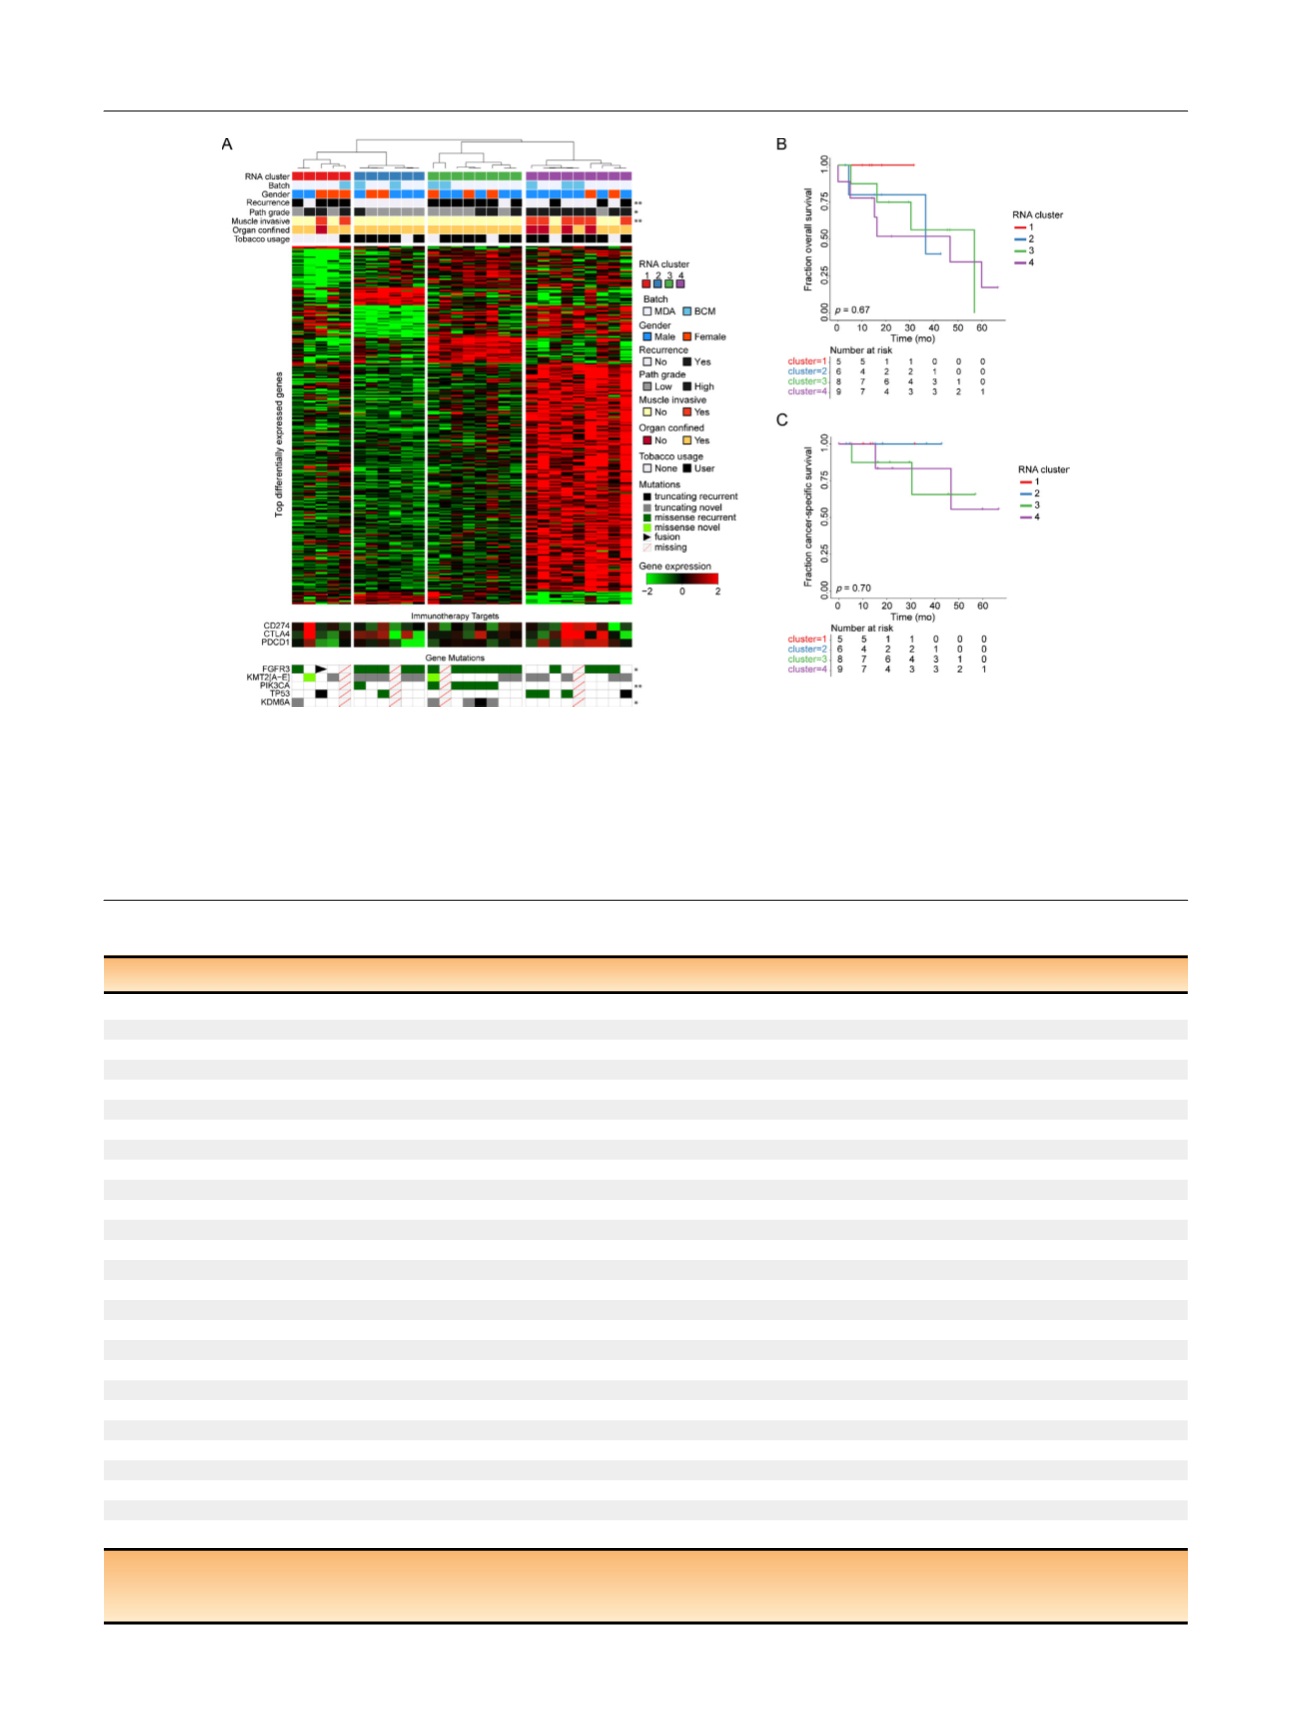
[(Fig._3)TD$FIG]
Fig. 3 – Gene expression subtypes. (A) Heatmap of unsupervised consensus clusters of RNA sequencing gene expression data. The heatmap shows the
signature genes that characterize each cluster by the nearest-shrunken-centroid (PAM) method at a false discovery rate (FDR) of 0.01. The gene values
shown are median-centered, variance-stabilizing transformed counts. The top tracks show the cluster ID, batch (generated in two different institutes),
and important clinical variables. Tumors with pathological stage T2, T3, or T4 are considered muscle-invasive, and Ta or T1 non–muscle-invasive.
Tumors with pathological stage Ta, T1, or T2 are considered organ-confined, and T3 or T4 non–organ-confined. The bottom tracks represent RNA
expression of targets of immunotherapy and the five most commonly mutated genes in upper tract urothelial carcinoma. Significant association
between covariate and subtypes indicated by * <0.05 and ** < 0.01. (B,C) Kaplan-Meier plots of overall survival and cancer-specific survival. Patients
are grouped by the RNA sequencing clusters shown in (A).
Table 2 – Clinical characteristics by consensus cluster (28 patients)
Cluster 1
Cluster 2
Cluster 3
Cluster 4
p
value
aPatients (
n
)
5
6
8
9
Median age at diagnosis, yr (IQR)
75 (68–77)
73 (68–73)
75 (70–77)
71 (62–83)
>
0.9
y
Gender,
n
(%)
0.6
Female (
N
= 10)
3 (60)
2 (33)
3 (38)
2 (22)
Male (
N
= 18)
2 (40)
4 (67)
5 (62)
7 (78)
Race,
n
(%)
0.7
Black (
N
= 2)
1 (20)
0 (0)
0 (0)
1 (11)
Hispanic (
N
= 1)
0 (0)
0 (0)
0 (0)
1 (11)
White (
N
= 25)
4 (80)
6 (100)
8 (100)
7 (78)
Tobacco use,
n
(%)
0.4
Current (
N
= 4)
0 (0)
1 (17)
2 (25)
1 (11)
Former (
N
= 15)
1 (20)
4 (67)
4 (50)
6 (67)
None (
N
= 9)
4 (80)
1 (17)
2 (25)
2 (22)
Pathologic T stage,
n
(%)
0.003
Ta/1 (
N
= 20)
3 (60)
6 (100)
8 (100)
3 (33)
T2/3/4 (
N
= 8)
2 (40)
0 (0)
0 (0)
6 (67)
Pathologic grade,
n
(%)
0.03
High (
N
= 15)
3 (60)
1 (17)
3 (38)
8 (89)
Low (
N
= 13)
2 (40)
5 (83)
5 (62)
1 (11)
Recurrence,
n
(%)
Any (
N
= 14)
4 (80)
0 (0)
7 (88)
3 (33)
0.002
Local (
N
= 4)
3
0
1
0
Bladder (
N
= 11)
3
0
5
3
Distant (
N
= 3)
1
0
2
0
Median FU for surviving patients, mo (IQR)
b14 (13–18)
16 (12–24)
37 (27–45)
22 (18–44)
NA
Median overall survival, mo (IQR)
14 (13–18)
17 (7.2–32)
30 (20–46)
16 (14–47)
NA
Deceased (
n
)
0
2
4
6
NA
IQR = interquartile range; FU = follow-up; NA = not applicable.
a
Significance test: Fisher’s exact test or Kruskal-Wallis rank sum test
y
. Significant
p
values in bold.
b
FU range for surviving patients, 3–66 mo.
E U R O P E A N U R O L O G Y 7 2 ( 2 0 1 7 ) 6 4 1 – 6 4 9
646