


 538 656

the corresponding proportions were 52%, 50%, 51%, 47%, and 46%. All the
results presented are therefore based on equal rates (100%).
In the main analysis, we estimated transitions for two different
scenarios in which all men eventually transitioned from AS to another
state
( Fig. 1B). In the first scenario we focused on men aged 55, 60, 65, or
70 yr with CCI = 0 starting on AS. More details on the methods used for
these estimations can be found in the Supplementary material. For the
second scenario, we performed estimations for a theoretical cohort
created using an annual inflow of men on AS selected as annual
bootstrapped samples of 1000 men from the pool of men on AS in
NPCR diagnosed with very low-risk PCa between 2010 and 2014. The
annual inflow of men was continued for a period of 40 yr. In both
scenarios, CCI was updated according to an independent model, as
described below.
2.2.3.
CCI model
A model for CCI development over time was required for the estimations
described above. In brief, this was achieved by estimating whether a
change in CCI took place or not for each time step. If a change in CCI had
occurred, the size of this change was estimated from a Poisson model,
together with a separate model handling CCI changes 6. Details of this
method can be found elsewhere
[19].
3.
Results
A total of 17 783 men with low-risk PCa on AS, WW, or DT
were recorded in NPCR between 1992 and 2014 (Supple-
mentary Table 1). After imputation of missing data, we
identified 7278 men with very low-risk PCa (median over
five imputation data sets with size ranging from 7169
to 7388).
Table 1shows the cohort characteristics at the time of
PCa diagnosis for imputation data set 1 by initial treatment
(AS, WW, DT). The number of men with very low-risk PCa on
AS increased during later time periods. Men on AS were
younger (mean age 65 yr) than men on WW (mean age
72 yr). The mean age in the DT group was 67 yr.
Figure 2shows the estimated proportion of men
(CCI = 0 at time of PCa diagnosis) who remained on AS,
failed AS, changed to radical treatment, changed to WW, or
died as a first event following AS over time. Older age at
start of AS was associated with a greater proportion of men
transitioning WW, whereas younger age was associated
with a greater proportion of men undergoing radical
treatment. For instance, within 10 yr from AS initiation,
10% of men aged 55 yr with CCI = 0 at start of follow-up
were estimated to transition to WW, compared to 50% of
men aged 70 yr.
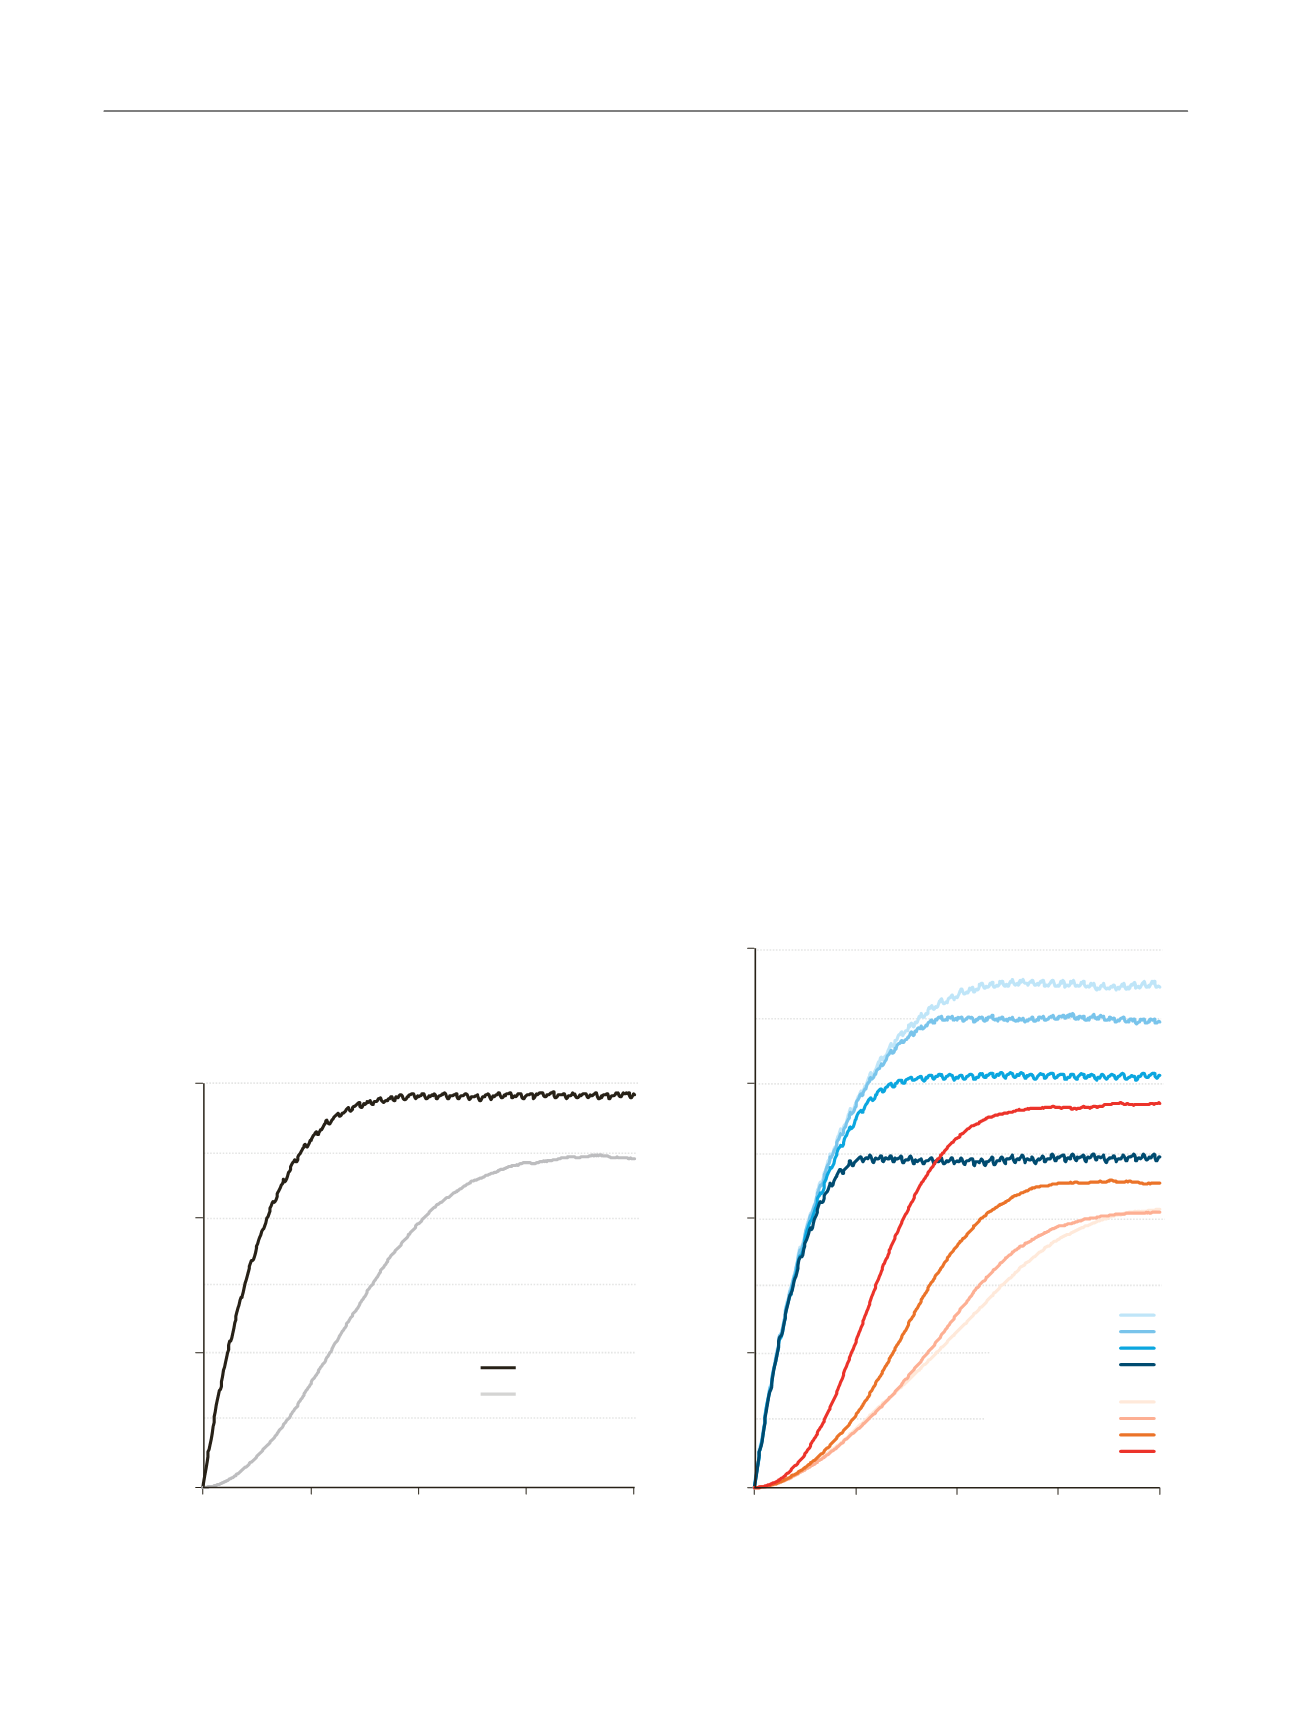
Figure 3shows the estimated prevalence of men who
either remained on AS or transitioned to WW over a period
of 40 yr according to our estimation model based on an
annual inflow of 1000 men with very low-risk PCa on AS.
The prevalence of men on WW increased slowly during the
first years, with the highest rate of prevalence change
occurring during 10–20 yr, and stabilised after 30 yr. The
age-specific prevalence simulations indicate that preva-
lence change occurred less frequently for younger men.
Tables 2 and 3further quantify these prevalence changes
and show that the time on AS decreases with age, whereas
the proportion of men changing to WW increases with age.
Overall, men with very low-risk PCa remained on AS for
[(Fig._3)TD$FIG]
Prevalence
Time (yr)
0
2000
4000
6000
0
10
20
30
40
AS
WW
Time (yr)
0
2000
4000
6000
8000
0
10
20
30
40
52–57 yr
58–62 yr
63–67 yr
68–72 yr
AS
WW
52–57 yr
58–62 yr
63–67 yr
68–72 yr
Prevalence
Fig. 3 – Estimated number of men who remained on active surveillance (AS) or changed to watchful waiting (WW) over a period of 40 yr for all ages
combined and for age groups 52–57 yr, 58–62 yr, 63–67 yr, and 68–72 yr. Estimation included an annual inflow of 1000 newly diagnosed men with
very low-risk prostate cancer in each stratum.
E U R O P E A N U R O L O G Y 7 2 ( 2 0 1 7 ) 5 3 4 – 5 4 1
538