


 537 656

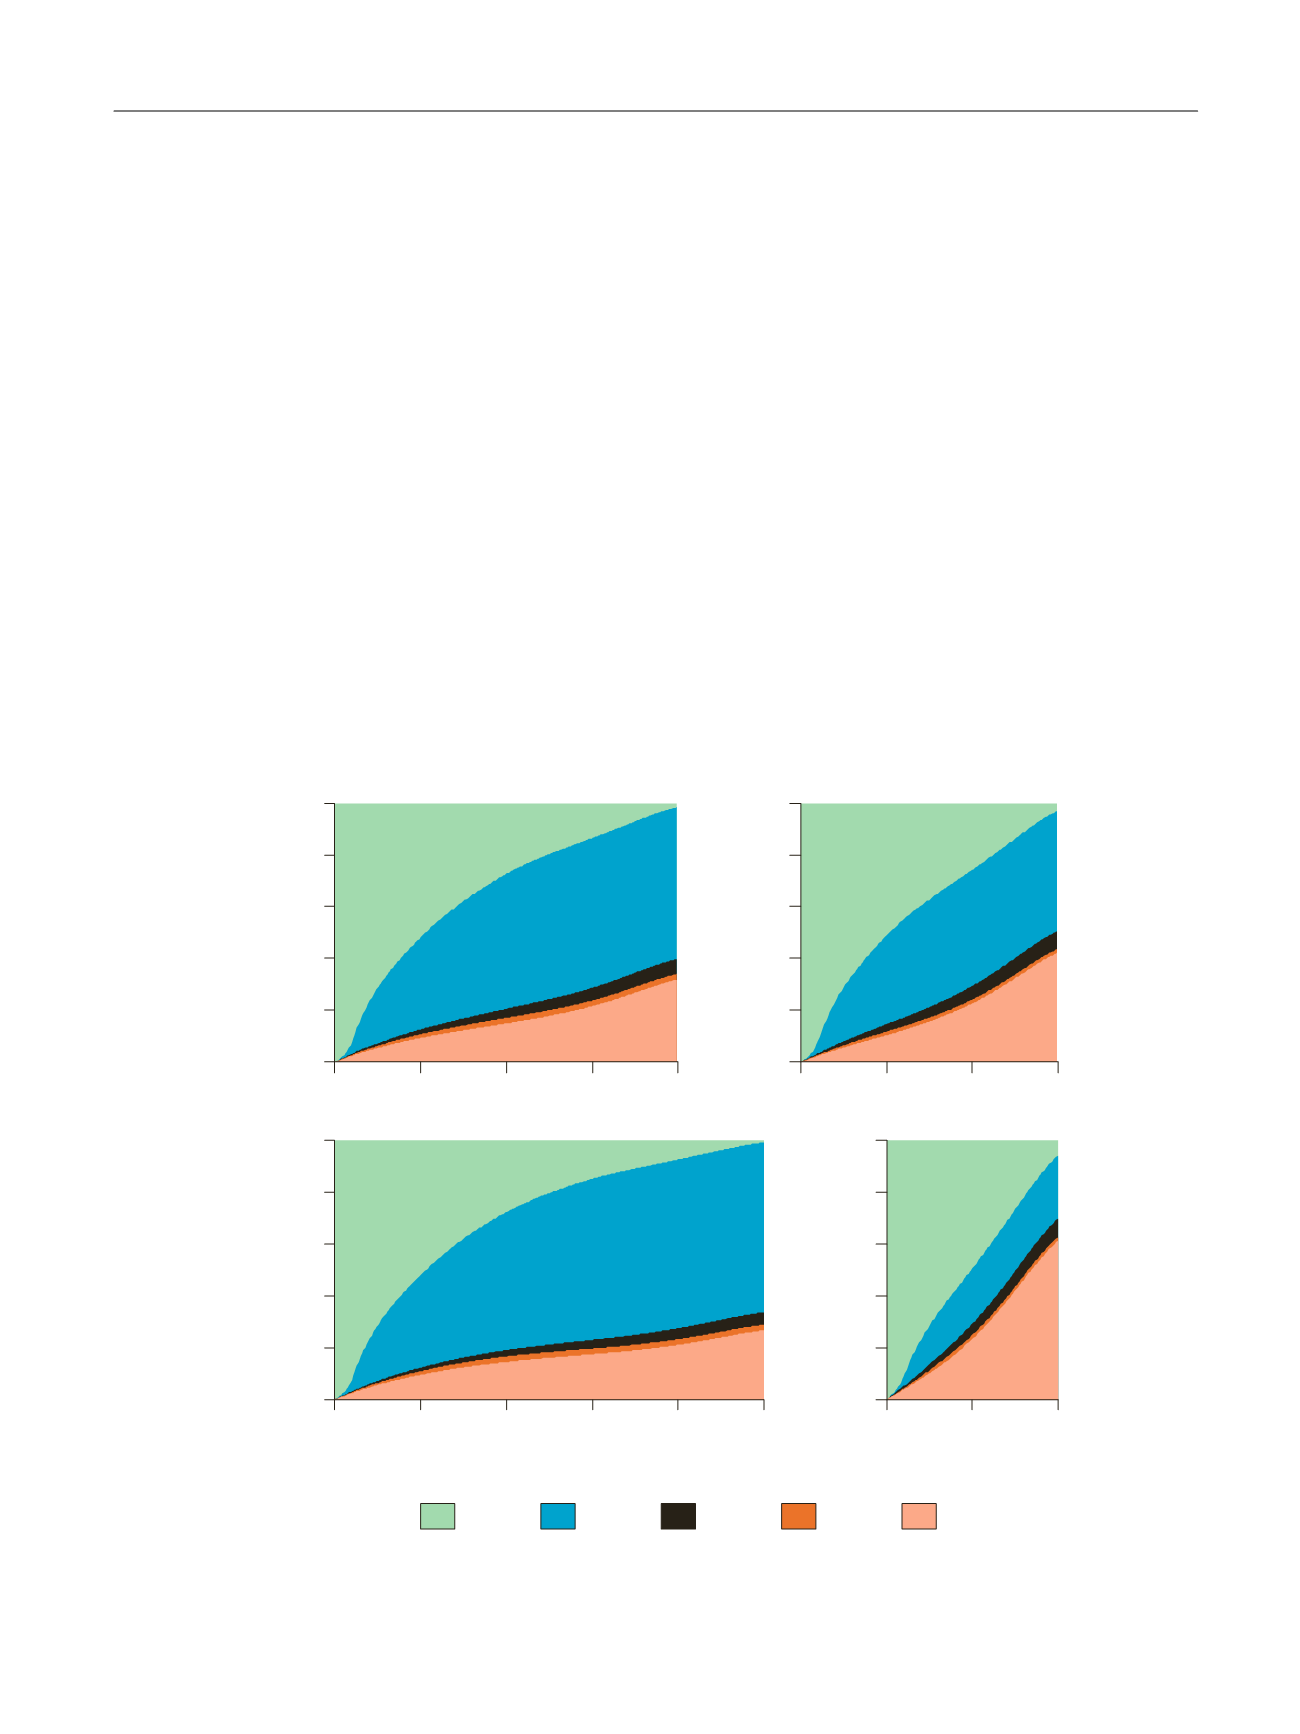 Figure 1
A because these were not intended to be studied in the current
study.
The basic assumption for all our modelling is that the age-specific
transition rates from WW to ADT are similar for men starting on WW
(WW
!
ADT) as for those starting on AS and those changing to ADT via
WW (AS
!
WW
!
ADT). In men starting on WW, the transition to ADT is
observable in the data, and therefore the transition rate for WW
!
ADT
can be estimated directly as shown in
Figure 1B (arrow II). Moreover,
since the start of ADT in the event chain AS
!
WW
!
ADT (arrow III) can
be observed, it is also possible to indirectly estimate the transition rate
for AS
!
WW (arrow I) using the above basic assumption (Supplemen-
tary material).
2.2.1.
State transition model
Our state transition model used discrete time steps of 4 wk. During each
time step, a man either remained in his state or moved to a new state.
Each man was followed from the date of diagnosis or January 1, 2006,
whichever came last (left truncation), until reaching an absorbing state
or the end of follow-up (December 31, 2014), whichever came first.
Using the date January 1, 2006 as study entry allowed for a 6-mo run-in
period, as ADT treatments were identified from the Swedish Prescribed
Drug Register, which only started on July 1, 2005.
Since the person-time on AS is unknown, the probability of directly
observable transitions such as death and curative treatment cannot be
estimated via logistic regression. We therefore created a single large
model incorporating all transitions in
Figure 1 Band their relation to
covariates such as age, time spent in a specific state, time since diagnosis,
and CCI. The regression coefficients were fitted using maximum
likelihood methods. The Supplementary material provides further
details on the model specifications.
In this model we also included additional indirect information as
follows. A biopsy was considered as an indication for remaining on AS,
whereas a long period without biopsies increased the likelihood of a
transition to WW. Initiation of curative treatment indicated that a man
had been on AS until that point in time. Initiation of ADT was considered
as evidence of a previous transition to WW in the model. However, there
were exceptions: When a young man with low comorbidity (CCI 0)
received ADT shortly after PCa diagnosis, this was defined as an AS
failure (Supplementary Table 2). A separate state-transition probability
was created for this situation (Supplementary material)
[2–6] .2.2.2.
Estimations
To visualise the fitted model in terms of the timing and occurrence of
state transitions in accordance with
Figure 1B, we calculated estimations
for men with specific age and CCI scores
[10]. First, we assessed the
sensitivity of our assumption of similar transition rates for AS
!
WW
and AS
!
WW
!
ADT. We therefore estimated the cumulative incidence
of AS
!
WW transitions based on five variations of our assumption using
relative transition rates of 50%, 80%, 100%, 150%, and 200%, but noticed
very little difference. For instance, for men aged 55 yr, the proportion of
men who switched to WWwithin 10 yr was 15%, 13%, 13%, 11%, and 10%,
respectively, for the five transition rates. Similarly, for men aged 70 yr,
[(Fig._2)TD$FIG]
0
5
10
15
20
25
Time (years)
0
0.2
0.4
0.6
0.8
1
Proportion
0
5
10
Time (years)
0
0.2
0.4
0.6
0.8
1
0
5
10
15
20
0
0.2
0.4
0.6
0.8
1
Proportion
0
5
10
15
0
0.2
0.4
0.6
0.8
1
CT
Death
WW
AS failure
AS
Age 70 yr
Age 55 yr
Age 60 yr
Age 65 yr
Fig. 2 – Proportion of men on active surveillance (AS) who remained on AS, failed AS, changed to watchful waiting (WW) or curative therapy (CT), or
died as the first event. All men presented with Charlson comorbidity index of 0 at the time of prostate cancer diagnosis.
E U R O P E A N U R O L O G Y 7 2 ( 2 0 1 7 ) 5 3 4 – 5 4 1
537