


 536 656

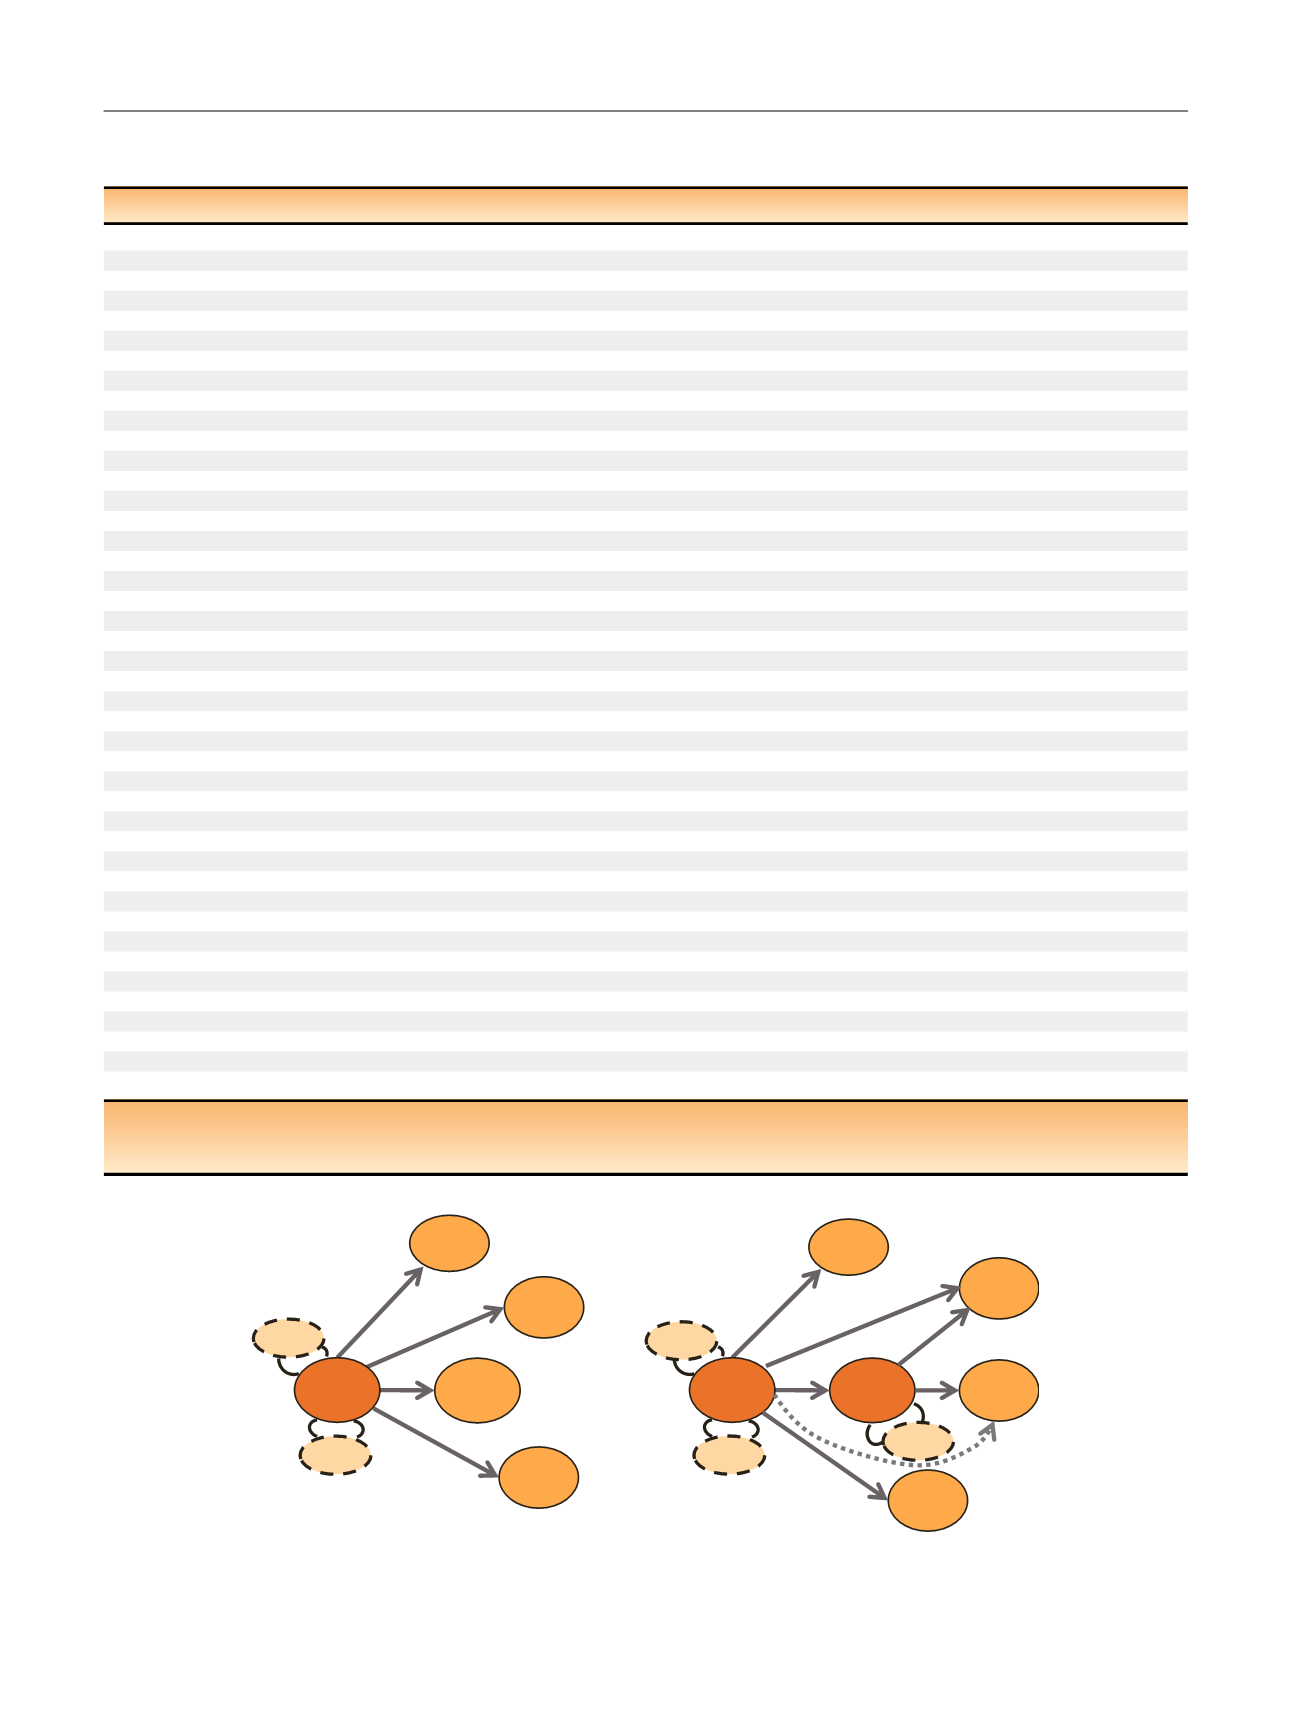
Table 1 – Baseline characteristics at time of prostate cancer diagnosis by initial treatment category for men in the study population in
PCBaSe (data taken from imputation data set 1)
AS (
n
= 5963)
WW (
n
= 537)
DT (
n
= 856)
All (
n
= 7356)
Median age, yr (IQR)
65.3 (61.0–68.8)
72.1 (68.4–75.6)
69.1 (63.5–72.2))
66.0 (61.6–69.8)
Age,
n
(%)
55 yr
364 (6.1)
6 (1.1)
41 (4.8)
411 (5.6)
56–60 yr
873 (14.6)
22 (4.1)
78 (9.1)
973 (13.2)
61–65 yr
1627 (27.3)
55 (10.2)
149 (17.4)
1831 (24.9)
66–70 yr
2095 (35.1)
112 (20.9)
208 (24.3)
2415 (32.8)
71–80 yr
1004 (16.8)
280 (52.1)
380 (44.4)
1664 (22.6)
81 yr
62 (11.5)
62 (0.8)
Year of diagnosis,
n
(%)
1992–1997
27 (3.2)
27 (0.4)
1998–2004
157 (2.6)
40 (7.4)
388 (45.3)
585 (8.0)
2005–2008
1037 (17.4)
151 (28.1)
359 (41.9)
1547 (21.0)
2009–2011
1977 (33.2)
208 (38.7)
47 (5.5)
2232 (30.3)
2012–2014
2792 (46.8)
138 (25.7)
35 (4.1)
2965 (40.3)
CCI,
n
(%)
0
4414 (74.0)
368 (68.5)
692 (80.8)
5474 (74.4)
1
754 (12.6)
94 (17.5)
86 (10.0)
934 (12.7)
2
421 (7.1)
40 (7.4)
56 (6.5)
517 (7.0)
3+
374 (6.3)
35 (6.5)
22 (2.6)
431 (5.9)
T stage,
n
(%)
T1c
5213 (87.4)
412 (76.7)
662 (77.3)
6287 (85.5)
T2
750 (12.6)
125 (23.3)
194 (22.7)
1069 (14.5)
N stage,
n
(%)
N0
674 (11.3)
38 (7.1)
19 (2.2)
731 (9.9)
Nx
5289 (88.7)
499 (92.9)
837 (97.8)
6625 (90.1)
Gleason score,
n
(%)
2–6
5958 (99.9)
536 (99.8)
794 (92.8)
7288 (99.1)
Missing
a5 (0.1)
1 (0.2)
62 (7.2)
68 (0.9)
PSA,
n
(%)
0–3.0 ng/ml
546 (9.2)
31 (5.8)
91 (10.6)
668 (9.1)
3.1–6.0 ng/ml
3813 (63.9)
281 (52.3)
441 (51.5)
4535 (61.7)
6.1–10.0 ng/ml
1604 (26.9)
225 (41.9)
324 (37.9)
2153 (29.3)
Median LCBC, mm (IQR)
1.5 (1.0–3.0)
2.0 (1.0–3.5)
1.5 (1.0–2.6)
1.6 (1.0–3.0)
Data missing,
n
(%)
1289 (21.6)
200 (37.2)
773 (90.3)
2262 (30.8)
Median PV, cm
3
(IQR)
42 (34–54)
48 (37–58)
45 (35–59)
43 (34–55)
Data missing,
n
(%)
647 (10.9)
121 (22.5)
767 (89.6)
1535 (20.9)
Median PPC (IQR)
0.10 (0.10–0.20)
0.17 (0.10–0.20)
0.10 (0.10–0.17)
0.10 (0.10–0.20)
Data missing,
n
(%)
493 (8.3)
106 (19.7)
760 (88.8)
1359 (18.5)
Mode of detection,
n
(%)
Screening
3648 (61.2)
219 (40.8)
303 (35.4)
4170 (56.7)
LUTS
1555 (26.1)
213 (39.7)
226 (26.4)
1994 (27.1)
Other symptoms
648 (10.9)
96 (17.9)
232 (27.1)
976 (13.3)
Unknown
112 (1.9)
9 (1.7)
95 (11.1)
216 (2.9)
AS = active surveillance; WW = watchful waiting; DT = unknown deferred treatment; CCI = Charlson comorbidity index; LCBC = length of cancer in biopsy
cores; PPC = proportion of cores with cancer; PV = prostate volume; LUTS = lower urinary tract symptoms.
a
In the case of missing Gleason score, all men had World Health Organisation grade 1.
[(Fig._1)TD$FIG]
RP/RT
AS
failure
Death
AS
WW
ADT
AS
failure
Death
AS
WW
B
A
CCI
CCI
CCI
Biopsy
Biopsy
RP/RT
I
II
III
Fig. 1 – State transition model defining transitions (arrows) between states (circles): active surveillance (AS) to curative treatment (radical
prostatectomy/radiotherapy, RP/RT), death, AS failure, or watchful waiting (WW) and androgen deprivation therapy (ADT). Red circles represent
transient stages and orange circles represent absorbing states. The light orange circles represent additional information gathered to facilitate the
estimation of transition probabilities (biopsy and Charlson comorbidity index [CCI]).
E U R O P E A N U R O L O G Y 7 2 ( 2 0 1 7 ) 5 3 4 – 5 4 1
536