


 585 656

[(Fig._5)TD$FIG]
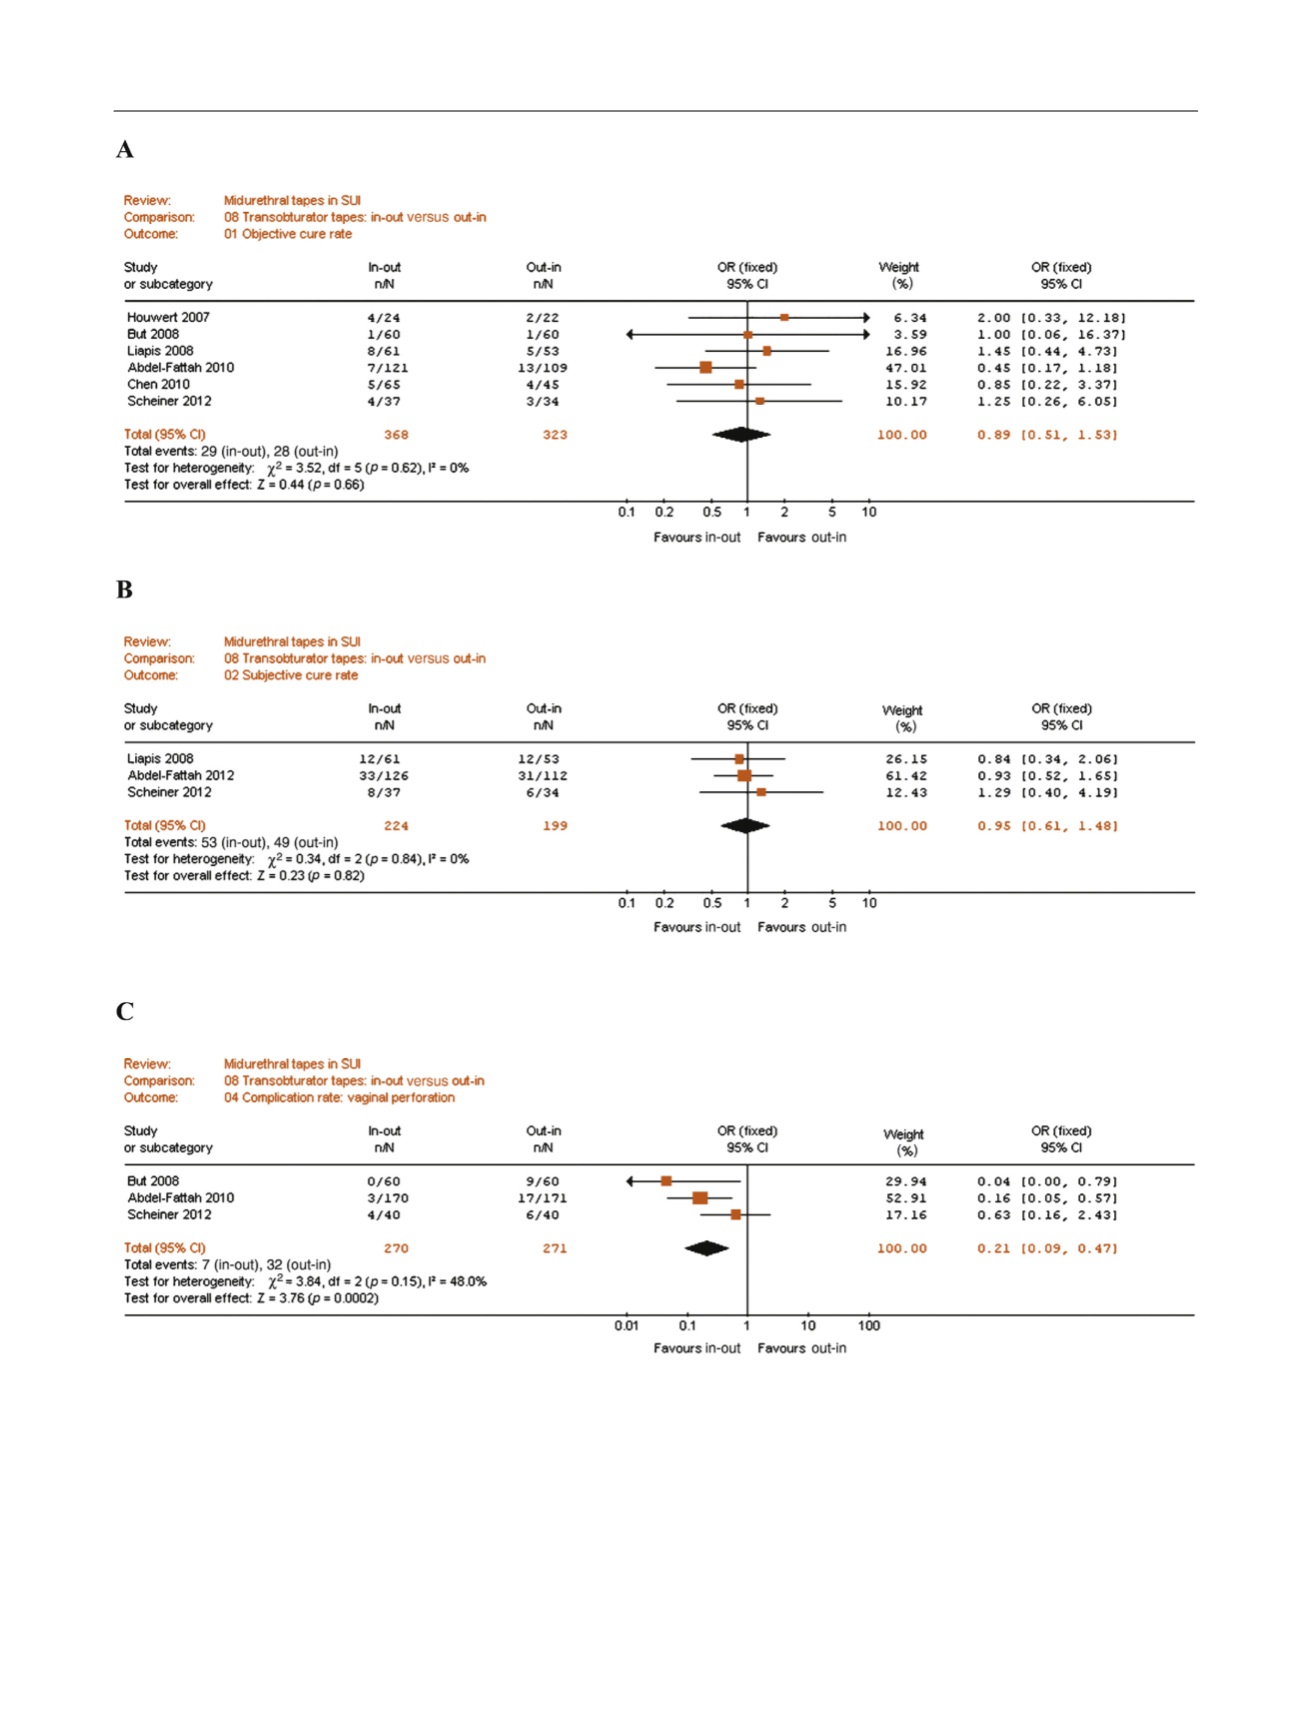
Fig. 5 – Forest plots of comparisons after different transobturator tapes: (A) objective continence rate, (B) subjective continence rate, (C) vaginal
perforation, (D) vaginal erosion, (E) urinary tract infection, (F) storage lower urinary tract symptoms (LUTS), (G) voiding lower urinary tract symptoms,
(H) need of clean intermittent catheterisation or recatheterisation.
CI = confidence interval; CIC = clean intermittent catheterization; OR = odds ratio; SD = standard deviation; SUI = stress urinary incontinence.
E U R O P E A N U R O L O G Y 7 2 ( 2 0 1 7 ) 5 6 7 – 5 9 1
585