


 570 656

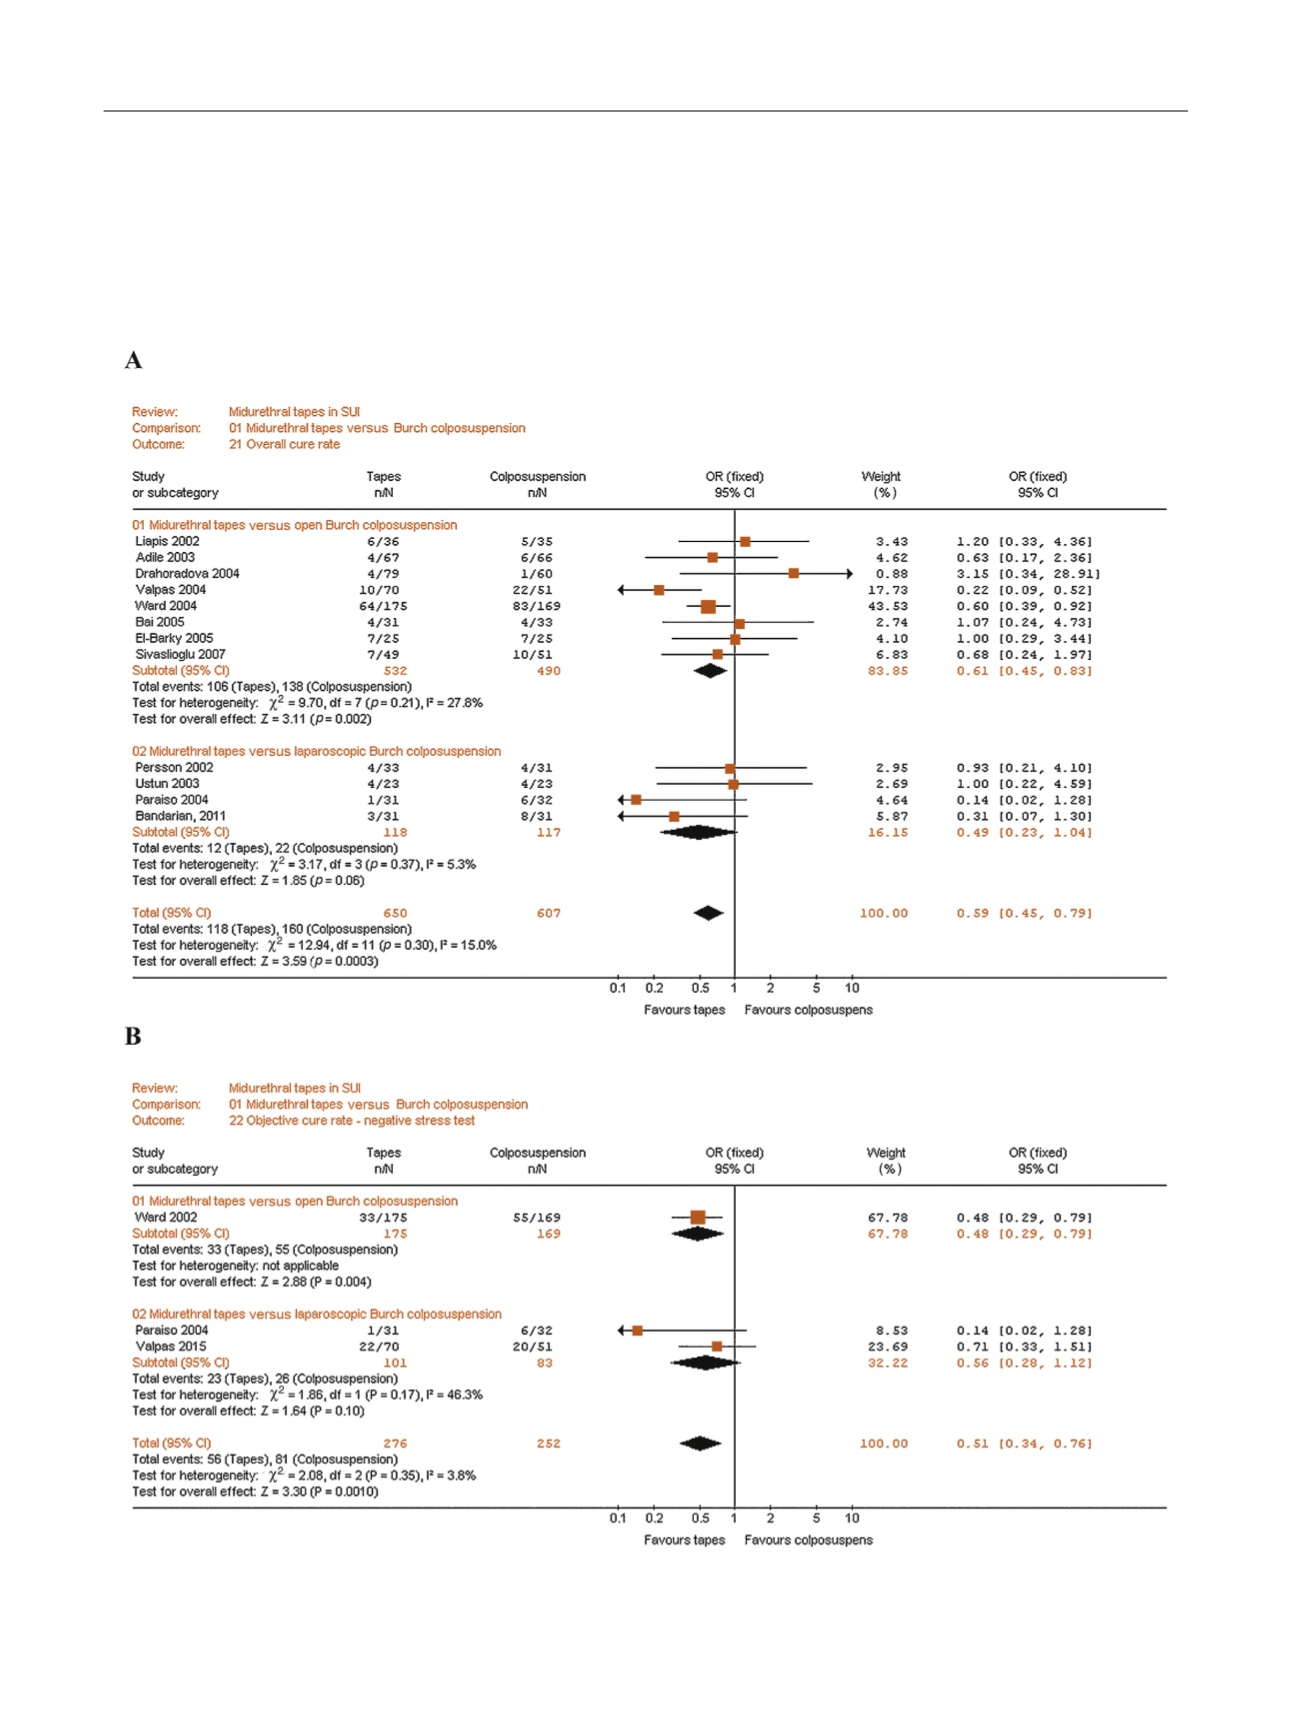
with BC, considering success rates evaluated according to
any definition of continence (82% vs 74%, respectively, OR:
0.59, 95% CI: 0.45–0.79,
p
= 0.0003;
Fig. 2 A), and objective
continence rates (negative stress test: 79.7% vs 67.8%,
respectively, OR: 0.51, 95% CI: 0.34–0.76,
p
= 0.001;
Fig. 2B). Notably, stratifying the BC outcomes according to
the surgical approach (open vs laparoscopic), the significant
difference in favour of MUS pertained for ‘‘any definition of
continence’’ and ‘‘objective continence rates.’’ Similarly,
there was some evidence of an effect in favour of MUS as
compared with laparoscopic BC for ‘‘any definition of
continence’’ but it did not meet conventional levels of
statistical significance (OR: 0.49, 95% CI: 0.23, 1.04,
p
= 0.06;
Fig. 2A).
[(Fig._2)TD$FIG]
Fig. 2 – Forest plots of comparisons after midurethral tapes and Burch colposuspension: Overall cure rate: continence rate according to (A) any
definition of continence, (B) objective continence rate, (C) subjective continence rate.
CI = confidence interval; df = difference; OR = odds ratio; SUI = stress urinary incontinence.
E U R O P E A N U R O L O G Y 7 2 ( 2 0 1 7 ) 5 6 7 – 5 9 1
570