


 561 656

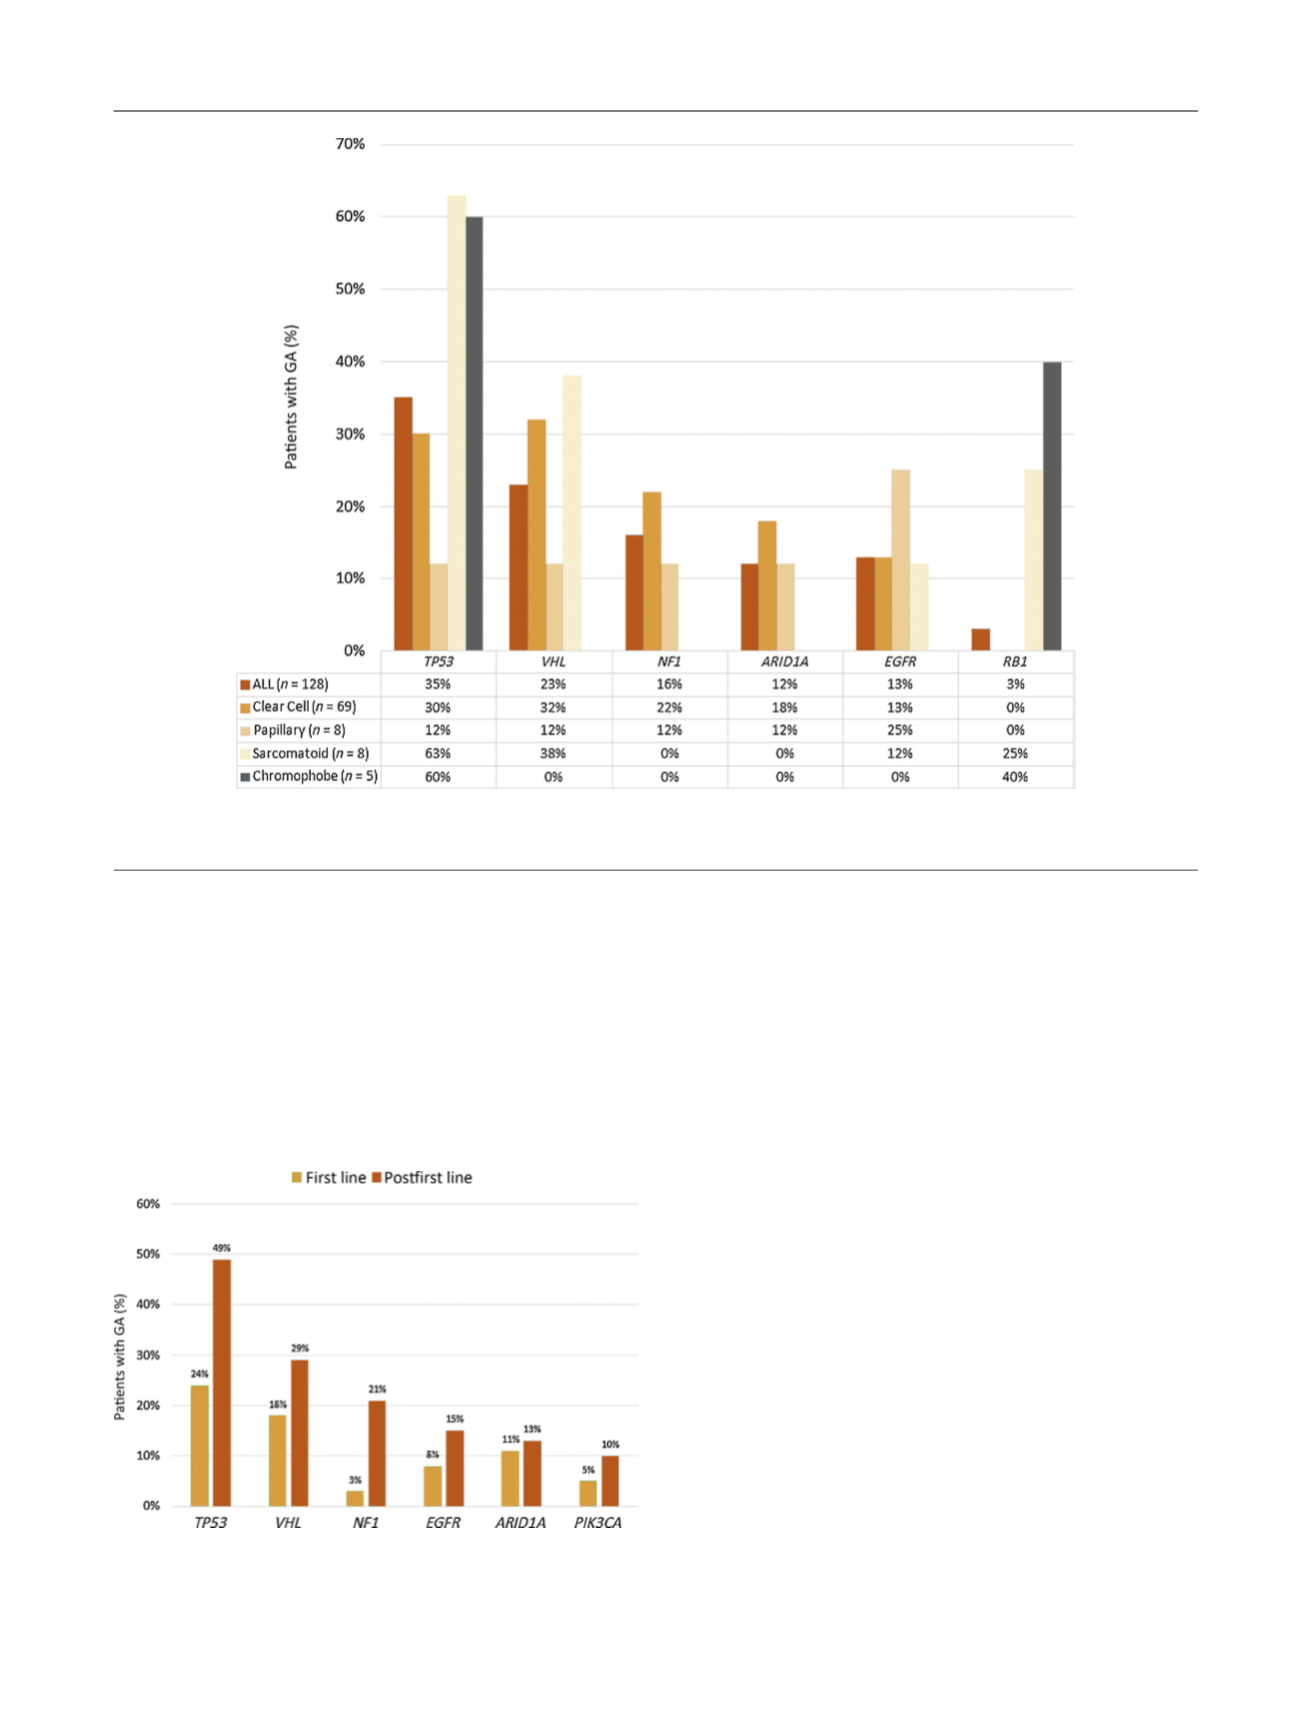
A key distinction in the TCGA RCC cohort is that the
specimen is from a primary nephrectomy and only 16.6% of
patients were noted to have Stage IV disease with the
majority being Stage I/II resected cancers
[10] .The ctDNA
cohort is composed only of advanced cancer patients, some
who had multiple lines of chemotherapy prior to testing.
Our study supports the notion that patients with advanced
disease may be genomically distinct. There are also
reports that ctDNA testing may detect important genomic
alterations, particularly in the resistance setting, that are
missed with a small tissue biopsy
[14,15]. In the TCGA
cohort, the frequency of
TP53
alteration was less than 3%
while, in contrast, the cumulative rate of mutation in our
series was 35%
[16]. For patients receiving postfirst-line
therapies, the rate of mutation was considerably higher
(25% vs 49%). In patients with localized RCC, upregulation of
p53 has been associated with poor disease-specific survival
[17]. Recent reports have suggested a complex interplay
between p53 and VHL that drives sensitivity to agents such
as sunitinib; defects in p53 therefore provide a plausible
explanation for VEGF-directed therapy resistance
[18].
Beyond
TP53
, other GAs noted more frequently in
postfirst-line patients appear to provide biological rationale
for agents currently used in the salvage setting. For
example,
NF1
and
PIK3CA
encode key regulators of the
mTOR signaling pathway
[19] .A recent study including
exceptional responders to everolimus across a wide variety
of malignancies suggested that
NF1
and
PIK3CA
mutations
(along with
TSC1/2
and
MTOR
mutations) occurred at a
higher frequency
[20] .In two phase 3 studies including
patients with metastatic breast cancer, mutations in
PIK3CA
were associated with improved progression-free survival
with everolimus therapy
[21]. Beyond specific alterations,
the increase in GA frequency between first-line and
postfirst-line patients may bear clinical relevance. Increas-
ing mutational burden and neoantigen formation have been
[(Fig._3)TD$FIG]
Fig. 3 – Frequency of selected genomic alterations (GAs) according to histology.
ALL = acute lymphoblastic leukemia.
[(Fig._4)TD$FIG]
Fig. 4 – Notable differences in genomic alteration (GA) frequency in
patients documented as receiving first-line therapy versus postfirst-line
therapy (
p
values were as follows:
TP53
:
p
= 0.02;
NF1
:
p
= 0.01;
VH
L:
p
= 0.26;
EGFR
:
p
= 0.6;
PIK3CA
:
p
= 0.3).
E U R O P E A N U R O L O G Y 7 2 ( 2 0 1 7 ) 5 5 7 – 5 6 4
561