


 559 656

involvement was not available. Seventeen patients had
multiple (2–3) ctDNA samples collected at different clinical
timepoints for a total of 243 ctDNA samples. Treatment-
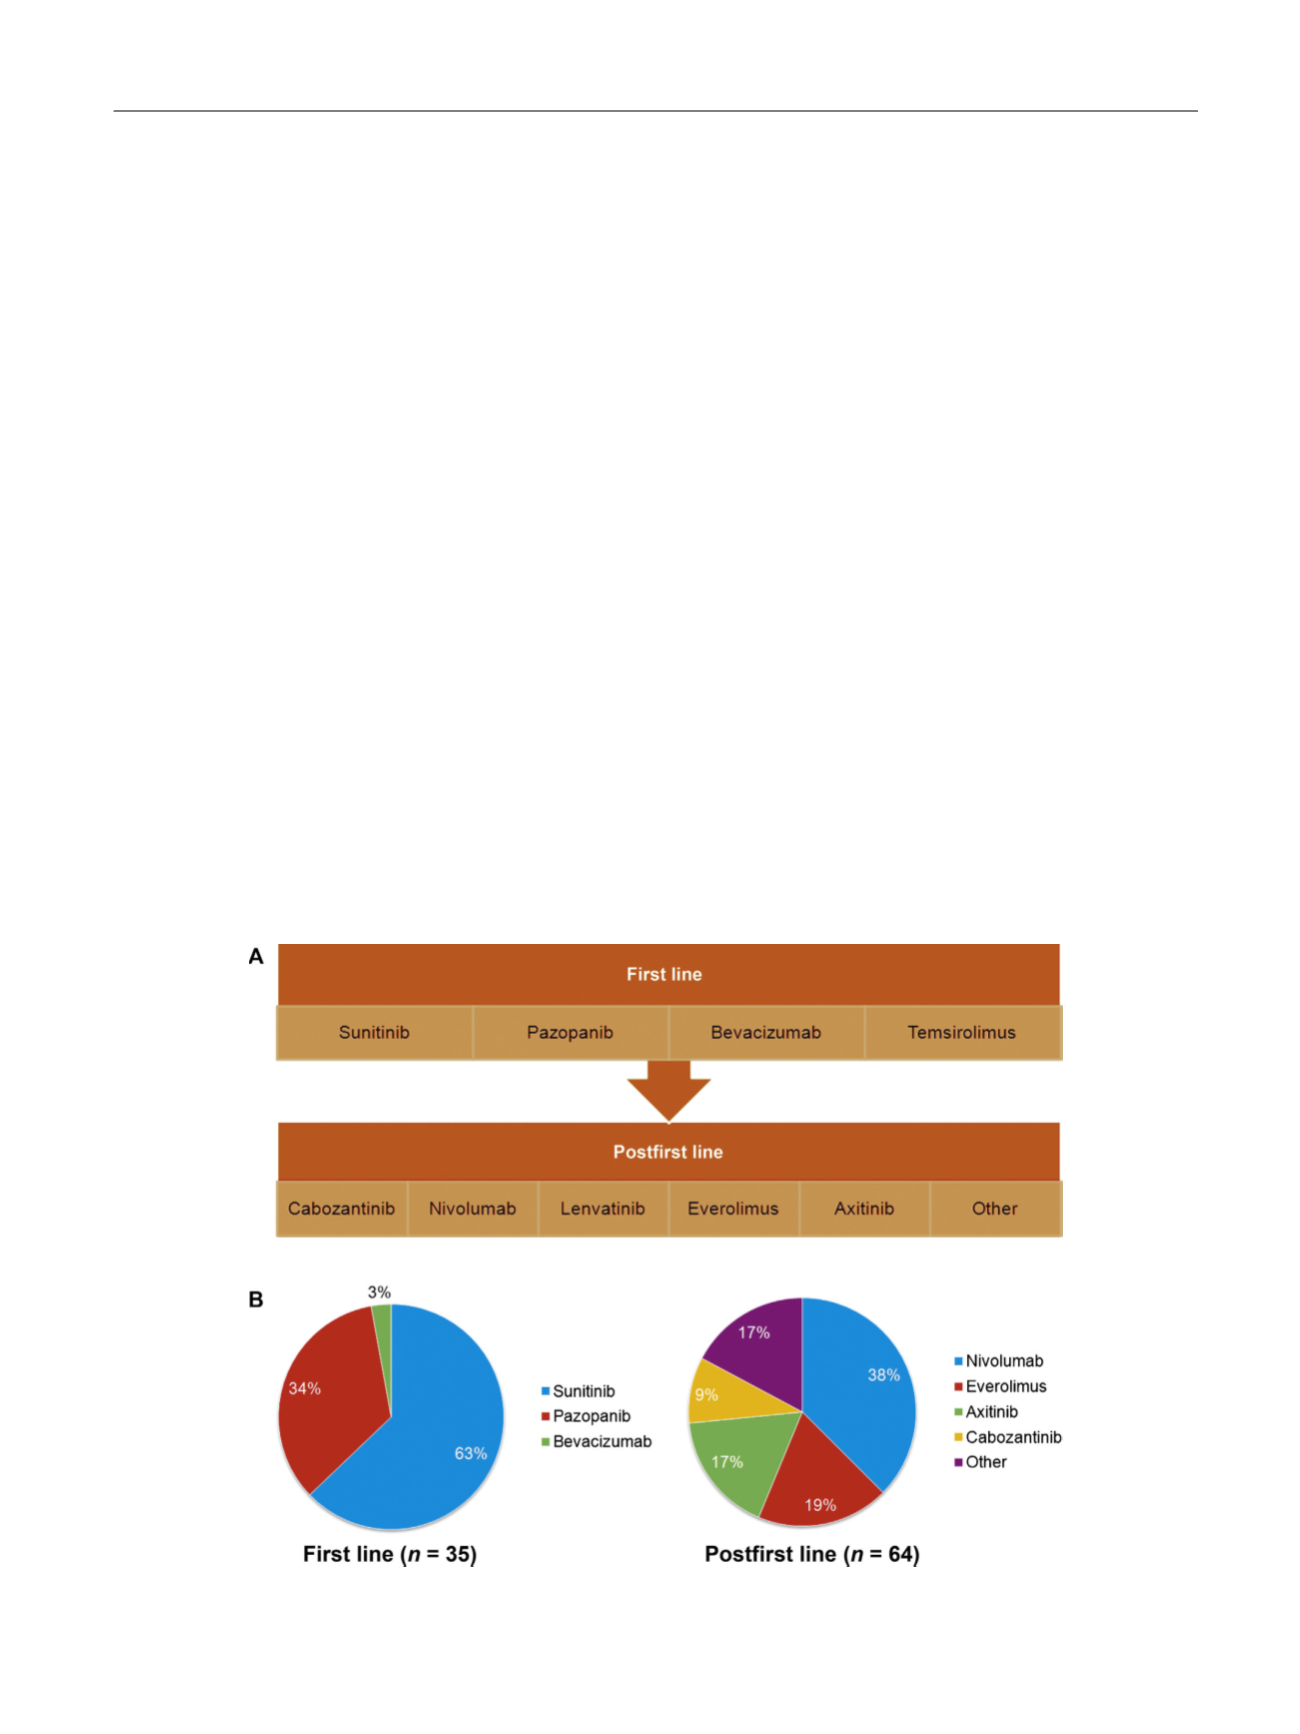
related data consistent with coding as first line or later line
was supplied with 99 samples: 35were considered first-line
therapy recipients while 64 were considered later line
( Fig. 1 A). The most commonly applied first-line treatments
were sunitinib (22 patients, or 63%) and pazopanib
(12 patients, or 34%;
Fig. 1 B). Of the 64 samples designated
as receiving second or later lines, the most commonly
applied treatments were nivolumab (24 patients, or 38%),
everolimus (12 patients, or 19%), axitinib (11, 17%), and
cabozantinib (6 patients, or 9%).
3.2.
GAs
In the overall cohort, GAs were detected in 79% of patients
with a median of one GA per patient (IQR: 0–3) among
patients with GAs detected. The most frequent GAs in the
overall cohort included
TP53
(35%),
VHL
(23%)
, EGFR
(17%),
NF1
(16%), and
ARID1A
(12%).
Figure 2 Adisplays the
cumulative number of GAs observed in the cohort, further
characterized by alteration type; of the 633 GAs identified
in the cohort, there was a preponderance of single
nucleotide variants and small insertions/deletions (indels;
89% of all mutations) compared with gene amplification
events (11%). Among single nucleotide variants and indels,
45% where characterized mutations with the remainders
variants of unknown significance.
The distribution of alterations was similar in patients
with documented clear cell RCC, with alterations in
TP53
,
VHL
,
NF1
,
EGFR
, and
ARID1A
occurring in 30%, 32%, 22%, 13%,
and 18% of patients, respectively. The cumulative number of
GAs in patients with documented clear cell RCC is noted in
Figure 2B. As noted, nonclear cell histology was infrequently
documented in the cohort. A comparison of GA frequency
including papillary, sarcomatoid, and chromophobe
patients is shown in
Figure 3. Higher frequencies of
TP53
and
NF1
mutations were noted in sarcomatoid and
chromophobe histologies; however, the cohort subsizes
were too small to achieve significance.
The median number of ctDNA alterations detected was
one (IQR: 0–3) in first-line and one (IQR: 0–3) in later-line
patients (
p
= 0.1) with median ctDNA variant allele fractions
of 0.20 (range: 0.05–7.3) in first-line patients and 0.24
(range: 0.04–47) in later-lines patients (
p
= 0.1). The highest
disparity in GA frequencies in postfirst-line versus first-line
patients were in
TP53
(49% vs 24%,
p
= 0.02),
NF1
(20% vs 3%,
p
= 0.01),
VHL
(29% vs 18%,
p
= 0.3),
EGFR
(15% vs 8%,
p
= 0.6),
and
PIK3CA
(10% vs 5%,
p
= 0.3;
Fig. 4 ). Isolating postfirst-
line VEGF-therapy versus first-line VEGF-therapy, these
differences were even more prominent:
TP53
(64% vs 31%,
p
= 0.04),
NF1
(29% vs 4%,
p
= 0.02), and
PIK3CA
(29% vs 8%,
p
= 0.07).
4.
Discussion
To our knowledge, the current series reflects the largest
assessment of ctDNA in mRCC to date, and further
represents the first characterization of trends in ctDNA
fluctuation during therapy. The presence of GAs in 79% of
the study population suggests a high yield, comparable to
[(Fig._1)TD$FIG]
Fig. 1 – (A) Characterization of first-line and postfirst-line therapy and (B) distribution of treatments amongst 99 patients with available treatment-
related data. (Note: not all patients receiving first-line therapy receive subsequent postfirst-line therapy; please refer to Material and Methods).
E U R O P E A N U R O L O G Y 7 2 ( 2 0 1 7 ) 5 5 7 – 5 6 4
559