


 635 656

analyses in a cohort that included men with incomplete biopsy data also.
Multiple imputation was used to compensate for missing information in
the variables of interest
[22].
3.
Results
3.1.
Baseline characteristics
Overall, 79 (12%) patients had LNI
( Table 1). The median
(IQR) number of lymph nodes removed was 16 (8–22). The
sites for positive lymph nodes were the obturator fossa
(
n
= 42; 53%); external (
n
= 34; 43%), internal (
n
= 20; 25%),
and common (
n
= 9; 11%) iliac stations; and presacral area
(
n
= 8; 9%). Preoperative PSA, biopsy grade group, percent-
age of positive cores, percentage of cores with highest-grade
PCa, maximum percentage of single core involvement with
highest- and lower-grade PCa, tumor length, tumor length
of highest-grade PCa, and percentage of tumor in biopsy
cores overall and stratified according to the presence of
highest- and lower-grade PCa differed among patients with
pN0 and pN1 disease (all
p
0.02). No differences were
observed with regard to age, the number of cores taken, and
the number of nodes removed (all
p
0.1). Robot-assisted
surgery was not associated with
[6_TD$DIFF]
the risk of LNI after
adjusting for preoperative disease characteristics (
p
= 0.2).
3.2.
Uni- and multivariable models predicting LNI
At univariable analyses, preoperative PSA, clinical stage,
biopsy Gleason grade group, percentage of positive cores,
percentage of cores with highest- and lower-grade PCa,
maximum percentage of single core involvement with
highest- and lower-grade PCa, and percentage of tumor in
biopsy cores overall and stratified according to the presence
of highest- and lower-grade PCa represented predictors of
LNI
( Table 2 ;all
p
0.04). At multivariable analyses,
preoperative PSA, clinical stage, biopsy grade group, and
percentage of cores with highest-grade PCa were indepen-
dent predictors of LNI. When these parameters were fitted
in four different multivariable models accounting for other
biopsy characteristics, model 1 achieved an AUC of 90.8%
and represented the basis for the novel nomogram
predicting LNI.
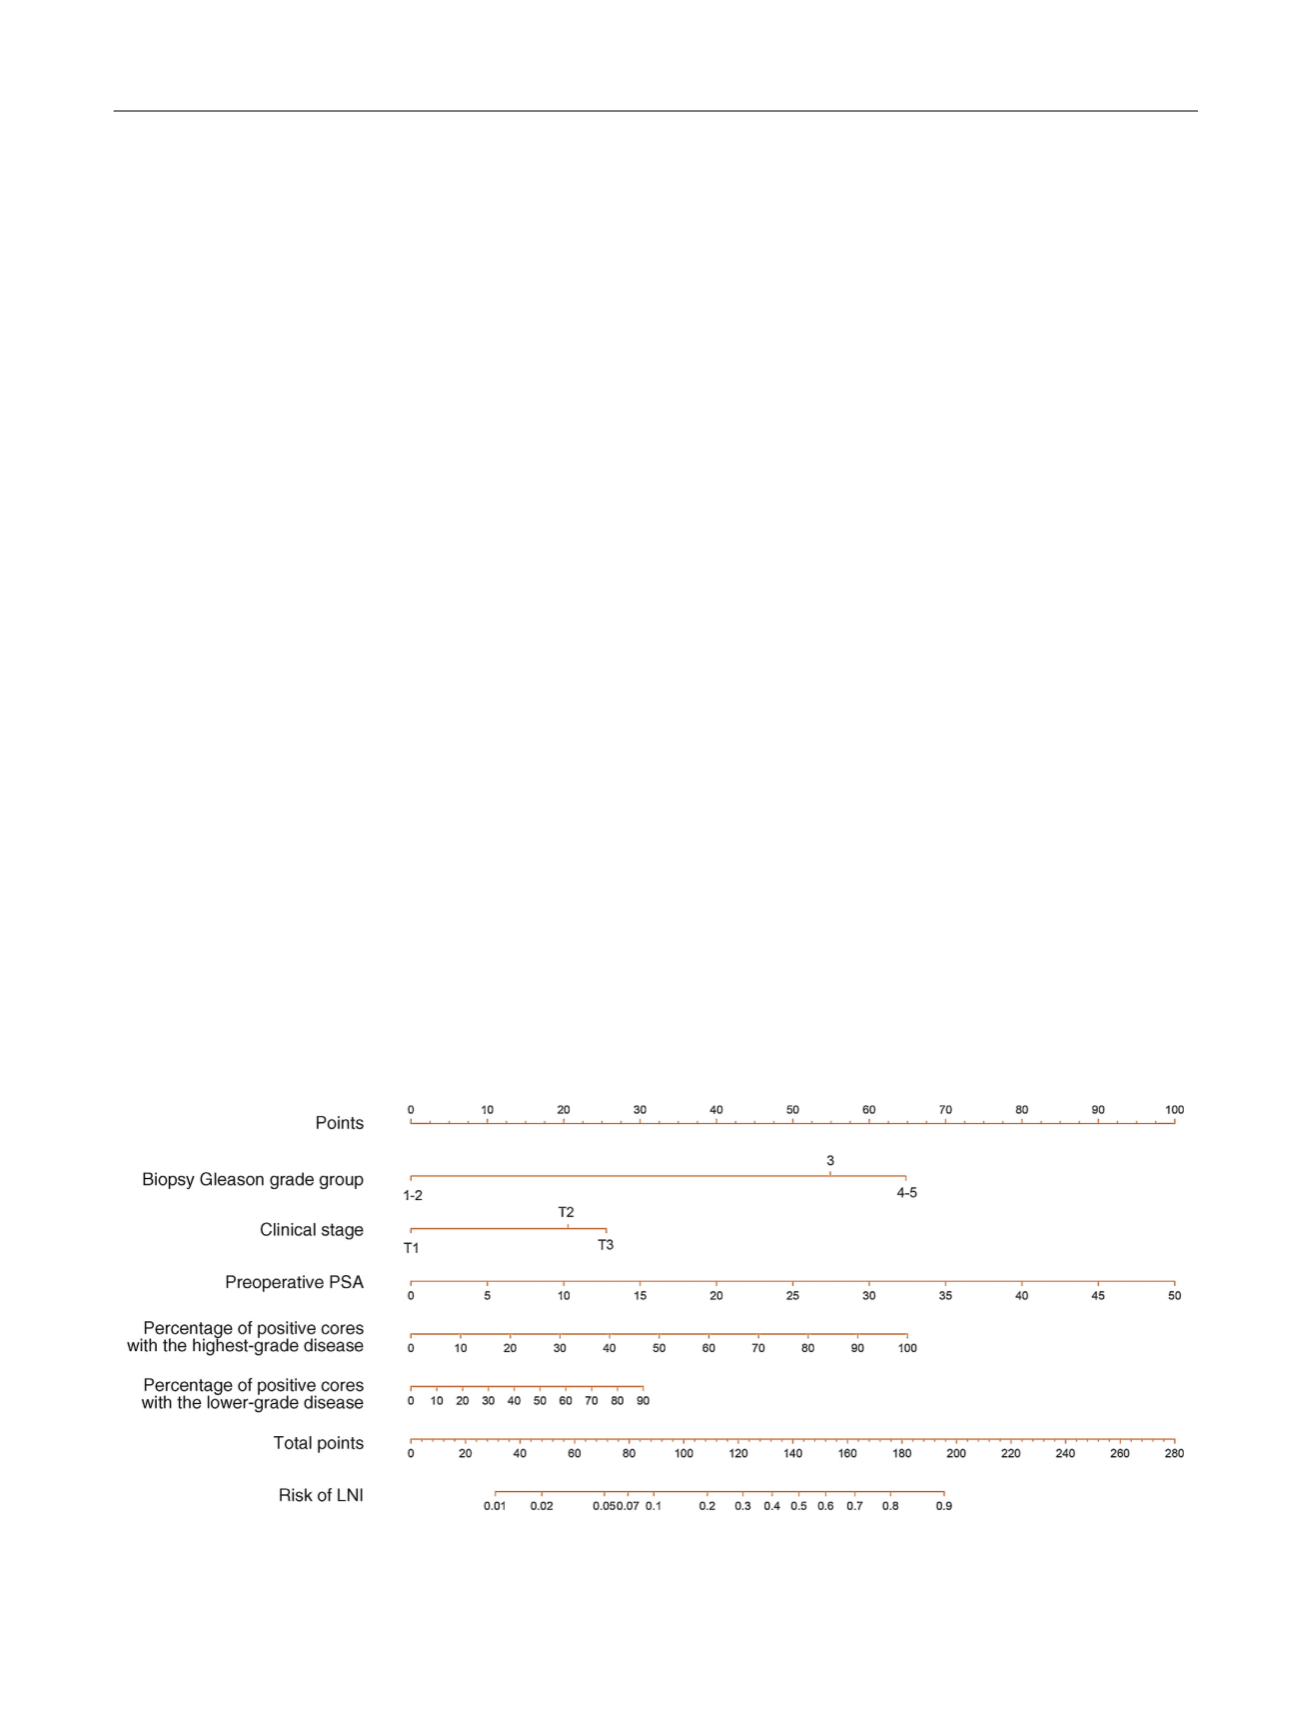
Fig. 1graphically depicts the multivariable
effect of each variable on the risk of LNI in the form of a
nomogram (coefficients are shown in Supplementary
Table 1). The calibration plot of predicted probabilities
against observed LNI rates indicated excellent concordance
( Fig. 2 ). The DCA demonstrated that the novel nomogram
improved clinical risk prediction against threshold proba-
bilities of LNI 20%
( Fig. 3).
Table 3depicts errors associated
with the use of the novel nomogram when predicting a low
risk of LNI. Using a 7% cutoff, 471 (69%) ePLNDs would be
spared and LNI would be missed only in seven (1.5%)
patients. Among patients with a risk of LNI
<
7% according
to the novel nomogram, positive lymph nodes were located
in the obturator (
n
= 3; 43%), external iliac (
n
= 2; 29%),
internal iliac (
n
= 1; 14%), and presacral (
n
= 1; 14%) regions.
3.3.
Comparison of the novel nomogram with currently
available models
The AUCs of the Briganti and MSKCC nomograms
[7_TD$DIFF]
in our
cohort were 89.5% and 89.5%, respectively. The calibration of
the Briganti and MSKCC nomograms tended to underesti-
mate the LNI risk across the entire range of predicted
probabilities (Supplementary Fig. 1 and 2). The use of the
novel nomogram resulted in the highest net benefit
compared with the Briganti and MSKCC models (Supple-
mentary Fig. 3). The use of a 7% cutoff of the novel nomogram
would allow for sparing a similar number of ePLNDs (69% vs
68%), with a lower number of LNIs missed (1.5% vs 2.2%) as
compared with the Briganti nomogram if the same 7%
[(Fig._1)TD$FIG]
Fig. 1 – Novel Briganti nomogram predicting the probability of lymph node invasion (LNI) in patients undergoing extended pelvic lymphadenectomy.
Instructions: Locate the patient’s Gleason grade group on the corresponding axis. Draw a line straight upward to the point axis to determine how
many points toward the probability of positive lymph nodes the patient receives for his Gleason grade group value. Repeat the process for each
additional variable. Sum the points for each of the predictors. Locate the final sum on the total point axis. Draw a line straight down to find the
patient’s probability of having LNI. PSA = prostate-specific antigen.
E U R O P E A N U R O L O G Y 7 2 ( 2 0 1 7 ) 6 3 2 – 6 4 0
635