


 627 656

As for the microbiome analyses, less abundant groups or
taxa (
<
1% in all samples) were excluded.
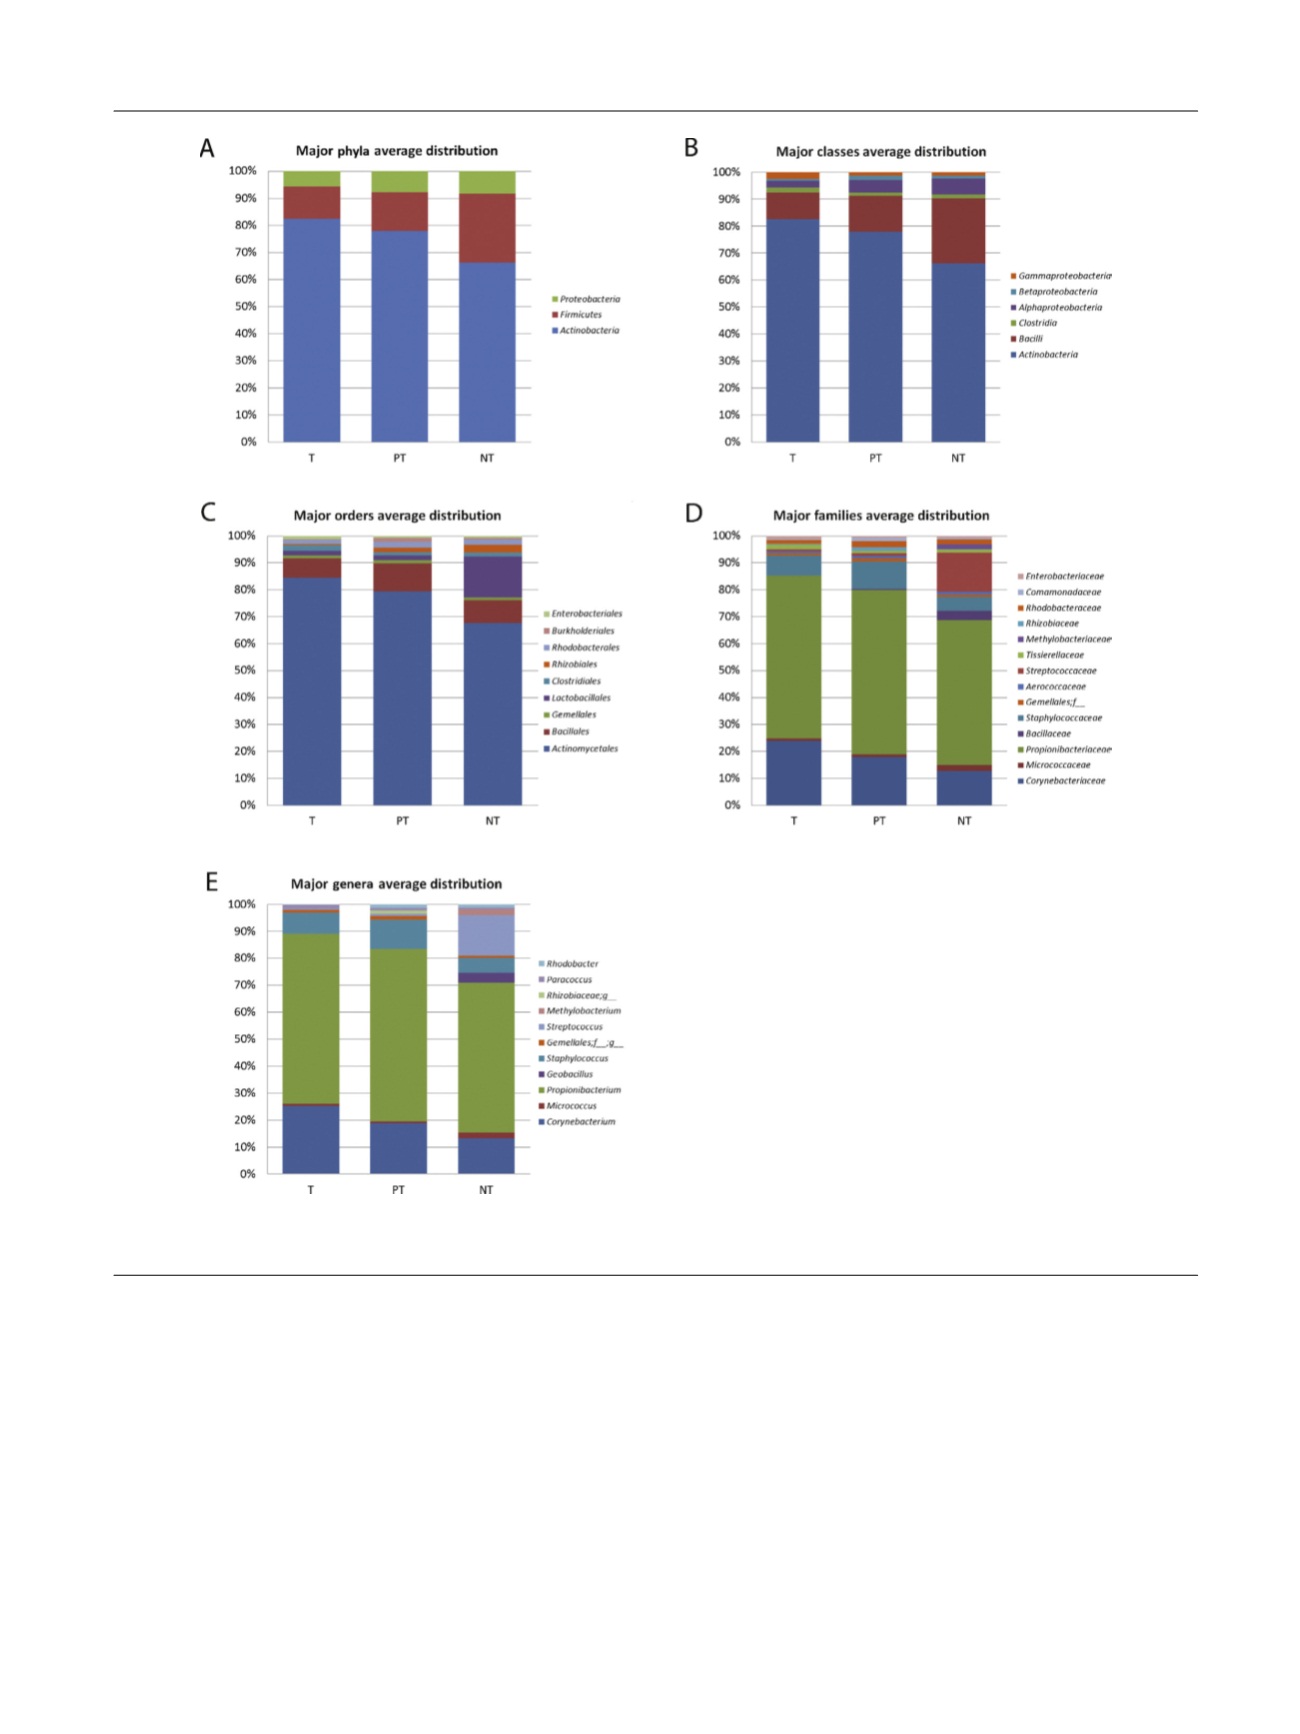
Based on homology searches and taking into account
only
phyla
detectable in at least one of the three sampled
regions, we observed the prostate microbiome is enriched
by
Actinobacteria
, as the dominant
phylum
in all types of
samples, followed by
Firmicutes
and
Proteobacteria
( Fig. 1A,
Table 1).
Possible misleading differences in total bacterial load
among prostate specimens were excluded since the
quantification by real-time polymerase chain reaction of
the bacterial presence, as defined using the 16S copy
number per microgram of extracted DNA, was not statisti-
cally different intrasample and intersample (data not
shown).
To deepen our research, we also performed analysis at
class, order, family, and genera levels and, when possible,
we typed the bacteria to the species level. We identified in
total 29 bacterial classes, 50 orders, 114 families, and
244 genera. Of those, respectively, six, nine, 14, and 11 had a
relative abundance higher than 1% in at least one area and
were considered for subsequent analysis. A list of taxa with
a median value
>
0.1% in at least one of the areas analyzed
and significant statistical differences among groups are
[(Fig._1)TD$FIG]
Fig. 1 – Bacterial average relative abundance in prostate tumor (T), peri-tumor (PT), and nontumor (NT) samples. Average distribution of major taxa is
represented by bar graphs (A) phylum, (B) class, (C) order, (D) family, (E) genus.
E U R O P E A N U R O L O G Y 7 2 ( 2 0 1 7 ) 6 2 5 – 6 3 1
627